Martha’s Vineyard 2013 Year-End Real Estate Market Review
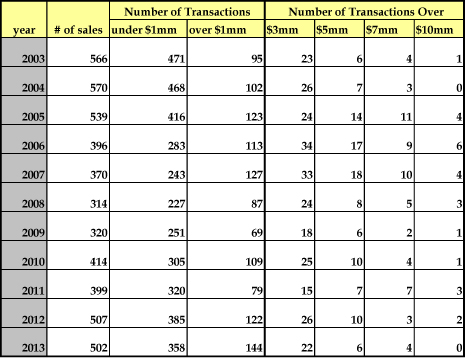
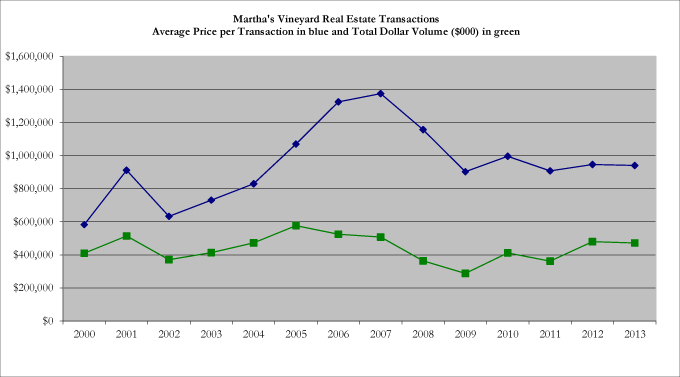
The real estate market on Martha’s Vineyard remained essentially flat in 2013 compared with 2012. The number of properties sold in 2013 decreased just 1% to 502, total dollar volume decreased similarly 1.5% to $472mm, and average sales price fell just 0.6% to $941,000.
This is in contrast to the national housing market, which saw home prices post the highest annual gains in eight years (Yale economist Howard Shiller, December 2013). While the Vineyard, a vacation destination, did not see the heated activity of some first-home markets (New York City, San Francisco), it did maintain the gains it made in 2012. This is particularly significant, as 2012 was a recovery year where the Vineyard real estate market finally showed significant signs of health. Dollar volume in 2012 was at its highest level since 2007 and total transactions were at a level higher than we’d seen since 2005.
After the recession in 2008, and some false starts, it appears that the Vineyard real estate market is gradually recovering. It has been an uneven and unpredictable process. A modest recovery on the Vineyard in 2010 was followed by another downturn in 2011 and then the rally in 2012. The first half of 2013 was sluggish, well behind 2012 first half performance. The lower number of transactions in early 2013 was not surprising, given the intense activity and record number of transactions at the end of 2012 (some propelled by uncertainty about the capital gains tax). Still, the slow start of 2013 suggested more of a roller coaster ride to come. That the market caught up in the second half of 2013 to hold just barely at 2012 levels is positive news. It suggests a slow but steady recovery, now consolidated over two years.
WILL THE BUYER’S MARKET CONTINUE?
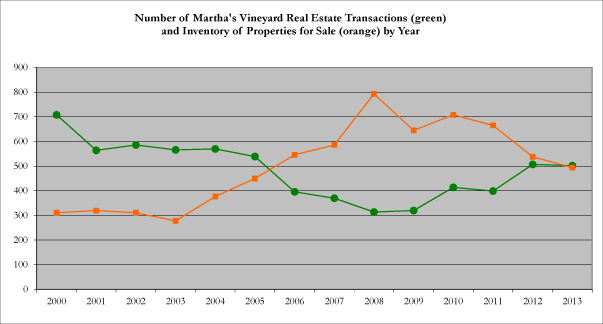
There are some signals that the buyer’s market of the past four to five years may be shifting. Although average prices remained flat from 2012 to 2013, well below 2005-2007 prices, the peak inventory level in 2013 was down 10% from the peak in 2012 (which was down 9% from 2011). This decrease in inventory could begin to put pressure on prices in 2014.
While the above statistics include all transactions and represent island-wide performance, individual towns and market segments reveal different dynamics in 2013. Martha’s Vineyard is an island with six towns, each with its own character and specific market conditions. Within each town there are different niches as well…waterfront, water view, high-end, mid-range, entry level and commercial properties. Because each of these market segments can be, on its own, very small, generalizing trends or making broad statements is difficult.
UP-ISLAND REAL ESTATE MARKET
Chilmark experienced a 42% decrease in the number of transactions (from 55 in 2012 to 32 in 2013), a 54% decrease in total dollar volume (from $86mm in 2012 to $40mm in 2013) and an average price decrease of 21% (from $1.57mm in 2012 to $1.24mm in 2013). The decrease in the number of transactions was not surprising. The large volume of sales in 2012 was an anomaly resulting from the unloading of old inventory and the push to avoid the capital gains tax of 2013. 55 transactions in 2012 (higher than any other year in the last 10 years) would be a difficult number for this small town to sustain. The 32 transactions which followed in 2013 represented a healthy number for Chilmark and a solid one in the context of the past ten years and the current recovery.
Surprisingly, 2013 saw a lack of transactions in the high end Chilmark market. This dip in the high end was the major cause of the 21% average price decrease between 2012 and 2013. (If you back out all sales over 3 million and re-average 2012 and 2013, the average price decrease is 6 % not 21%.) In 2013, only two Chilmark properties sold for over 3 million while in 2012 there were eight. In 2013, there were no sales over 4 million while in 2012 there were five (ranging from 4 million to 6.9 million. ) In such a small high end market, it is impossible to generalize from one year and extrapolate trends for the future. The Chilmark high end market is driven by unique properties where just a few sales make a difference.
It is important to note that the average Days On Market for the properties that sold in Chilmark continues to be much longer (622 days) than the island-wide average of 318 days, which means that this market is still holding old inventory and more of it finally moved in 2013. Chilmark saw a similar situation in 2011 when sellers held out for higher offers and then decided to negotiate in 2012 to move their inventory which proved an excellent year for the town. Perhaps we’ll see this same trend in Chilmark in 2014 where sellers decide to negotiate further and move more property, or perhaps the slow shift to a seller’s market, coupled with the expected rise in interest rates, will cause buyers to come back and reconsider.
Aquinnah’s number of transactions fell from 12 in 2012 to 11 in 2013, which is technically a decrease of 8% but with such small numbers, the actual decrease of 1 sale is not a significant story. The total dollar volume for Aquinnah in 2013 stayed level from $10.7mm in 2012 to $10.7mm in 2013. Average price in Aquinnah was up 8.5% to $969,000 (from $893k in 2012). Historically Aquinnah is linked to Chilmark sales since many up-island buyers move further out to get more for their money, but with Chilmark sales down in 2013, Aquinnah held steady.
West Tisbury had a modest 4% gain in the number of transactions from 52 in 2012 to 54 in 2013. Again, the difference of two sales is not much of a story but the dollar volume tells more. Although more properties sold in 2013, they were at lower price points. 50% of homes sold between $380,000 and $650,000 and total dollar volume fell 7% (from $60mm in 2012 to $56mm in 2013). There was a 10% decline in average price (from $1.16mm in 2012 to $1.04 in 2013) and an 18% decline in median price (from $777,000 in 2012 to 640,000 in 2013). Last year we talked about the return of a strong mid-market in West Tisbury because 2012 reported 20 sales in the $1.0-2.5mm range, a segment of the market which was lagging in the recent past. 2013 had 12 transactions in this range, but also had 4 sales over $2.5mm versus only 2 in 2012. So although West Tisbury saw a decline in dollar volume, average price and median price, the high-end remained relatively healthy.
DOWN-ISLAND REAL ESTATE MARKET
Each of the down-island towns of Vineyard Haven, Edgartown and Oak Bluffs experienced completely different results in 2013.
Edgartown was the growth winner this year with a 14% increase in number of transactions (from 162 in 2012 to 184 in 2013) and 10% increase in total dollar volume (from $203mm in 2012 to $223mm in 2013). Average price in Edgartown fell slightly (3%) from $1.25mm in 2012 to $1.21mm in 2013. Edgartown had the highest sale on the island in 2013 at $10,000,000. But overall, the high-end in Edgartown (over $3mm) was off last year with 12 transactions over $3mm in 2013, compared to 16 in 2012 (with two of those over $10mm). On the other end, the number of sales under $1mm in 2013 represented 58% of all transactions in the town, which is down from 68% of all transactions in 2012. Therefore, the growth in Edgartown this year occurred in the mid-range ($1-3mm).
Although, Vineyard Haven had exactly the same number of transactions in 2013 as in 2012 (101), the story here is the impressive increase in dollar volume of 41% from $59mm in 2012 to $84mm in 2013, which also drove up average price at the same rate (41% increase from $588k in 2012 to $831k in 2013). This activity was driven by 22 sales over $1mm in 2013 versus only 9 in 2012.
While Edgartown experienced growth in 2013 and Vineyard Haven remained flat but featured stronger high-end sales, Oak Bluffs saw a modest decline. Oak Bluffs had a 4% decline in number of transactions (from 125 in 2012 to 120 in 2013) and 3% fall in total dollar volume (from $61mm in 2012 to $59mm in 2013). The average price rose slightly (1.5%) to $494k (from $486k in 2012).
ENTRY LEVEL SALES
For the first time since the great recession hit in 2008, it became more difficult to enter the Martha’s Vineyard real estate market in 2013. The annual number of sales under $1mm on the island has risen every year since the low of 227 in 2008. And in 2012, there were 385 sales under $1mm, more than in any year since 2005. But in 2013, this trend shifted and the number of sales under $1mm decreased to 358. Foreclosures have had a major impact on the number of sales under $1mm in the past few years but fortunately 2013 saw a decline in the number of foreclosures (down 53%) from 58 in 2012 to just 27 foreclosures in 2013. Looking at specific towns, Aquinnah had no foreclosure sales, Chilmark had 1, Edgartown had 8, Oak Bluffs had 12, Vineyard Haven had 5 and West Tisbury had 1.
We have been following sales of homes under $1mm in Chilmark which is a small but significant number that had been climbing the past few years but declined in 2012 to 7 and held there at 7 in 2013 (from 9 in 2011, 6 in 2010 and 4 in 2009).
HIGH-END SALES
The high-end segment of the market slowed from 26 sales over $3mm in 2012 to 22 sales over $3mm in 2013. Although there were 4 sales over $7mm in 2013 compared to 3 over $7mm in 2012, there were no sales over $10mm in 2013 while 2012 had 2 sales over $10mm. The peak in this segment occurred in 2006, but the last two years give some encouragement for sellers in this segment of the market which was hard hit in 2009 and again in 2011. The 2013 high-end segment represented 22% of the total dollar volume of the market versus 28% in 2012 (see our chart below for more details).
COMMERCIAL TRANSACTIONS
The sale of commercial properties slowed in 2013 to 12 (down from 20 in 2012 and 15 and 2011). The average price of a commercial transaction was $1,840,000 in the years 2005-2008. Average price declined in 2009 and 2010 until the low in 2011 of $749,000. However, 2012 saw in increase in average price to $975,000 and 2013 continued the trend with an average price of $989,000. The median price of a commercial transaction was $762,500 in 2012 and fell to $425,000 in 2013. The largest commercial real estate transaction in 2013, which is pushing up the average price while other indicators are down for this segment, was the sale of Maciel Marine on Lagoon Pond Road in Vineyard Haven for $4.5mm.
Conclusion
Although Martha’s Vineyard is a sought after destination with a limited number of properties, we are inextricably connected to the world around us and have felt the impact of the national economic situation over the past five years. As the country’s economy slowly recovers, we see the positive effects on the island’s real estate market. 2013 kept pace with 2012 and although that doesn’t seem like exciting news at face value, the deeper story here is that 2013 offered some stability in a market which had been unpredictably fluctuating from year to year since 2008. 2012 was a solid year that pulled us up from the dismal performance of the Martha’s Vineyard real estate market in 2011, and 2013 kept up with 2012 performance.
Although the Martha’s Vineyard market overall was flat in 2013, we cautiously observe that there are signs it is continuing to shift: 1) peak inventory levels fell two years in a row, and 2) there were more sales in 2013 over $1mm than in any year since 2003 (when we started tracking data). Sellers can take encouragement from this news as well as the sustained level of activity in 2013. On the other side, all of this information, combined with rising interest rates, slowly starts to put some pressure on buyers for the first time in many years. However, prices remain well below the highs of 2005-2007 and these adjusted prices continue to offer value for buyers.
While the Vineyard real estate market held solid in 2013, it did not experience the rapid price increases which some other national markets did. The Wall Street Journal reported that “Real estate has been busting out of its long slump, but many vacation spots are lagging behind….and that is good news for buyers. Home prices nationally have risen at their fastest annual rate in seven years, with some communities seeing double-digit price gains as buyers compete for a thin supply of properties. Many vacation-home markets, though, are recovering at a slower pace and the choices for buyers remain plentiful.” (Ruth Simon, senior special writer, Wall St. Journal, May 24, 2013)
What will 2014 bring? Will the Martha’s Vineyard real estate market sustain its level of activity again or perhaps grow more strongly? How will other national and world events affect our local economy?
Last year we wrapped up by saying, “We are hopeful that our 2012 activity level can be sustained, but also believe that the pace of this upturn in the Vineyard market will likely be slow and gradual.” Looking back at 2013, these words ring true and it seems an appropriate prediction for next year as well. We remain optimistic about the year ahead for buyers and sellers alike.