2017 MARKET REVIEW - TEA LANE HIGHLIGHTS for 2017
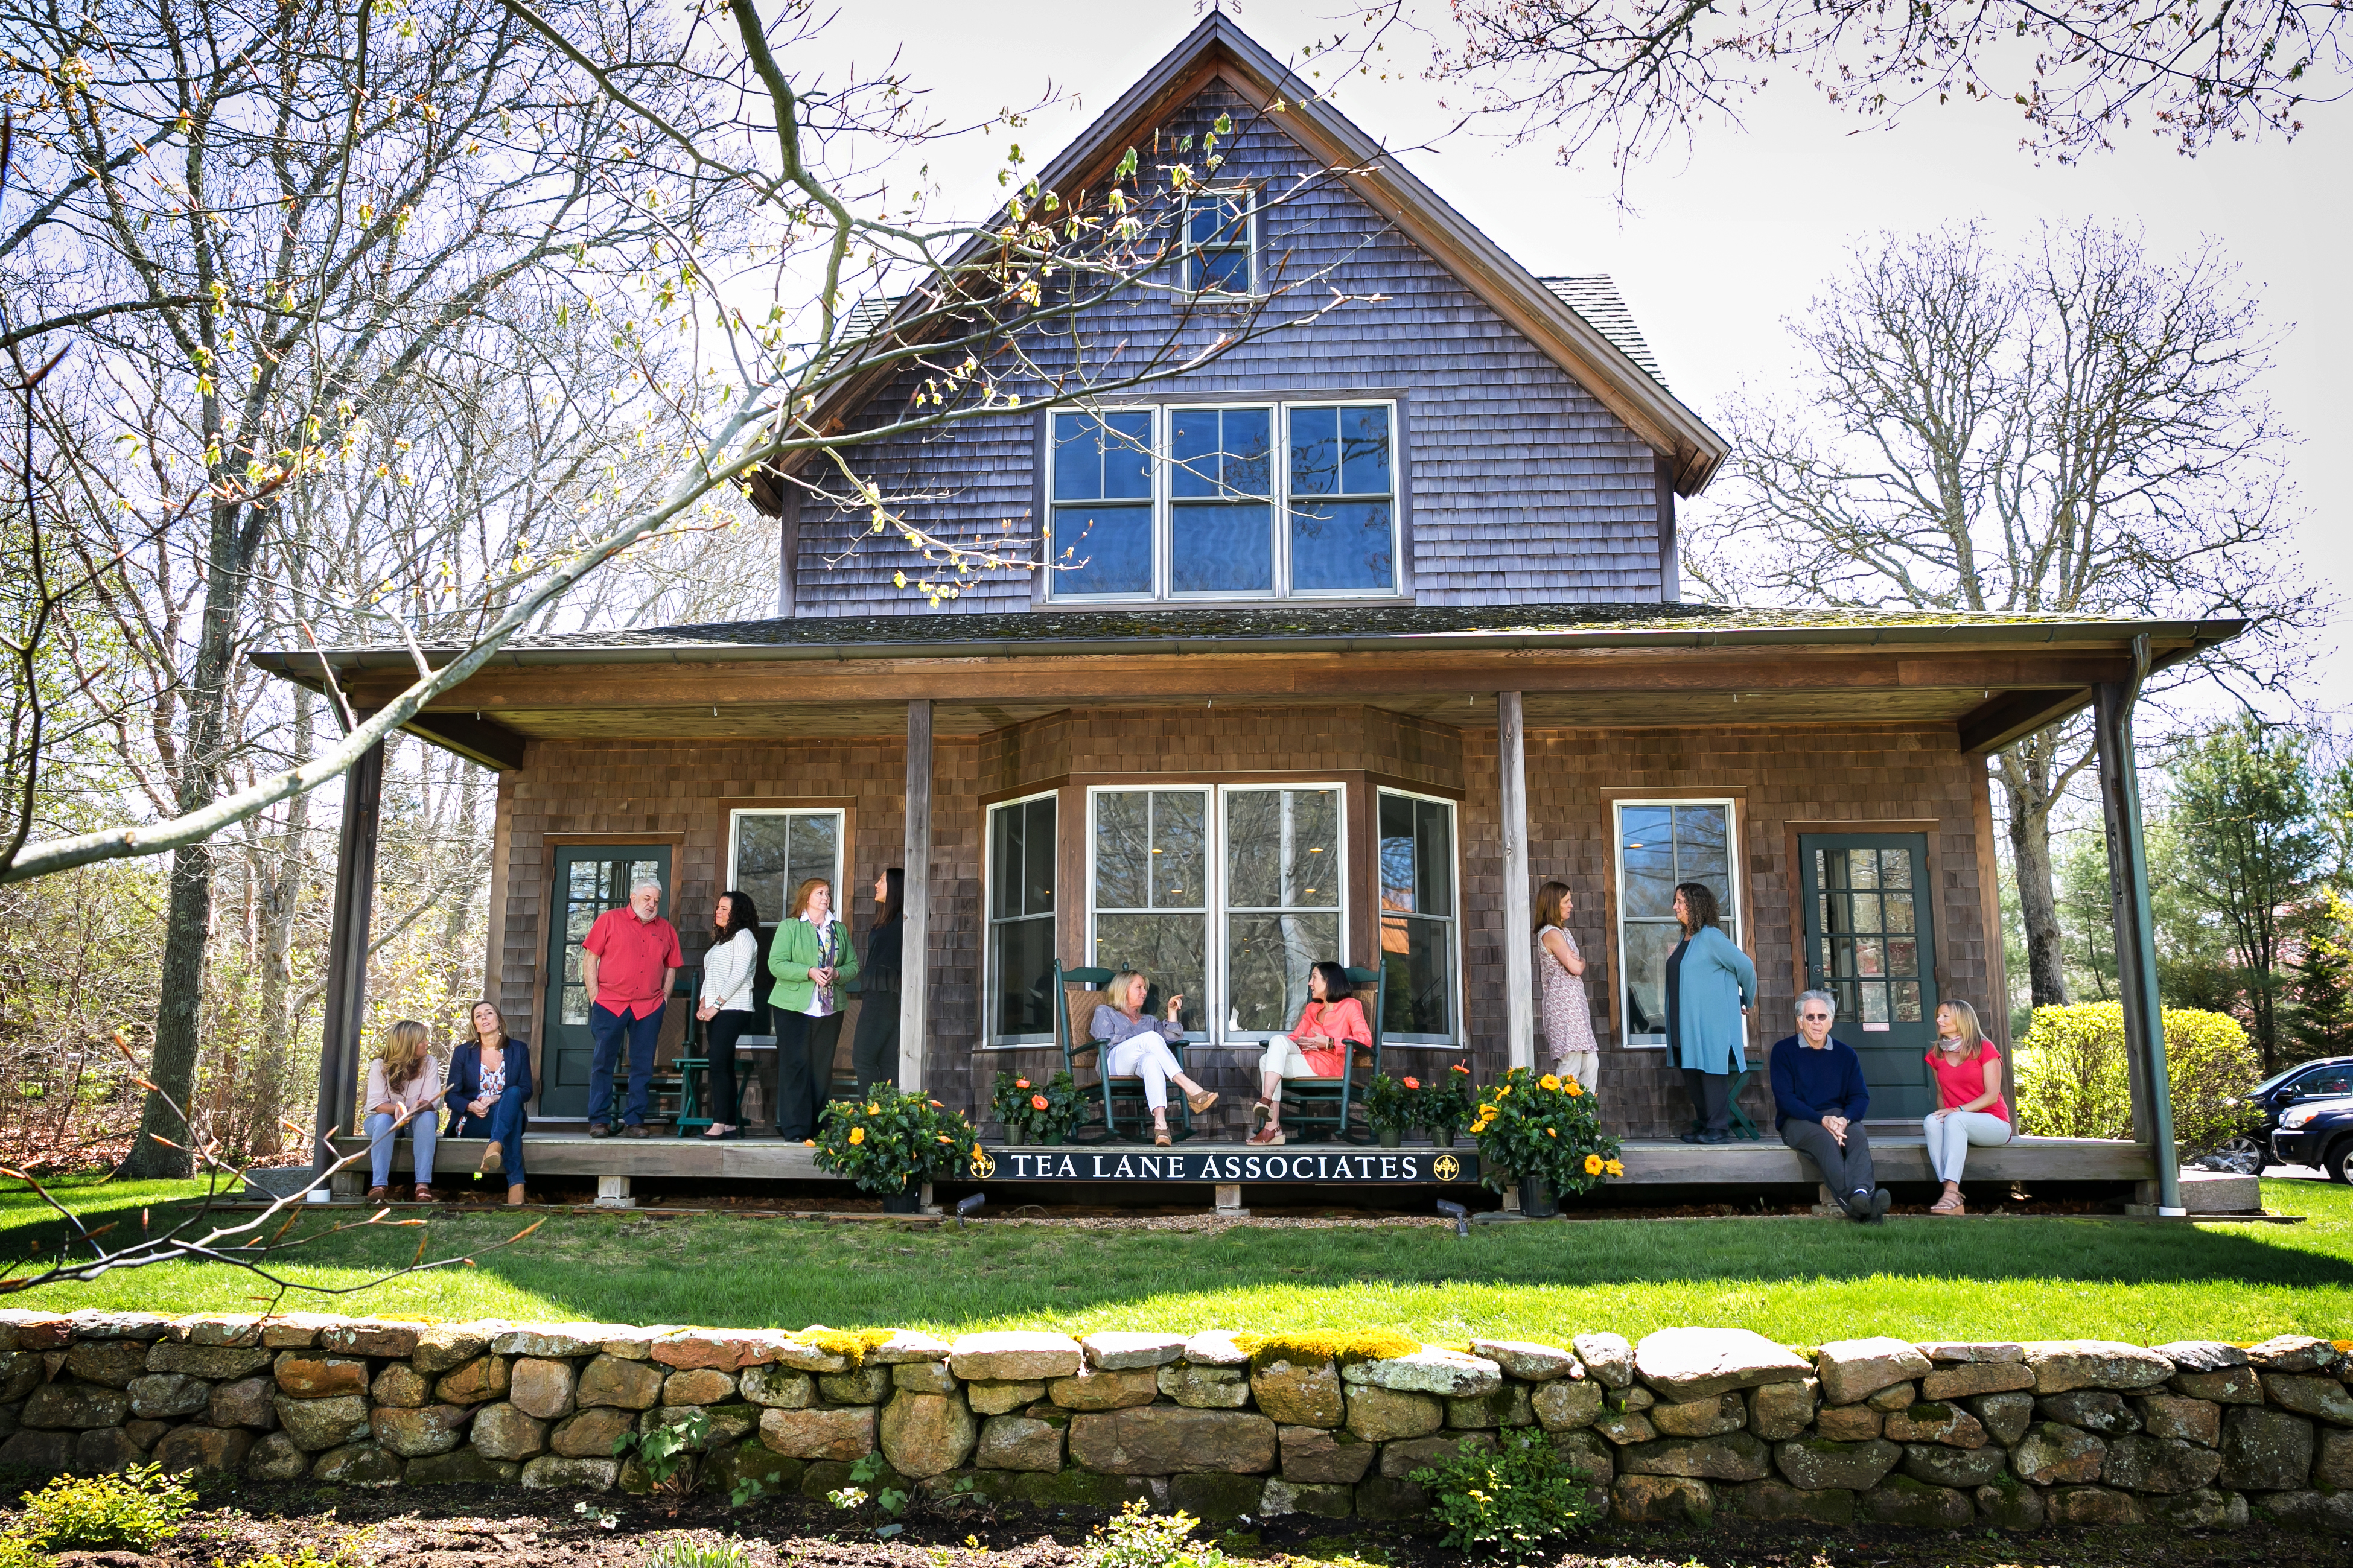
Image
This years "TEA LANE 2017 YEAR-END HIGHLIGHTS" are really impressive!
****Tea Lane Associates sold property in all six towns including 3 of the 4 highest priced properties in Aquinnah, 2 of the 3 highest priced properties in Chilmark, and the third highest priced property in Tisbury in 2017
****Tea Lane Associates’ sales represented 31% of all up-island sales dollar volume, and 11% of dollar volume island-wide
**** Tea Lane Associates’ sales represented 56% of dollar volume in Aquinnah, 36% of dollar volume in Chilmark and 23% of dollar volume in West Tisbury.
**** Tea Lane Associates’ represented the Seller of the highest priced, brokered, commercial transaction in 2017 which was an anchor retail space on Main Street in Vineyard Haven.
**** Tea Lane Associates represented buyers and sellers at all price points. - We worked with buyers purchasing their year-round family home, with buyers purchasing their retirement home and with buyers purchasing their perfect vacation retreat. We worked with sellers to list and sell a wide range of properties.
All are an important part of what we do and we were honored to be part of a new chapter in our clients’ lives. .....See our full report below with some great statistics and interesting information to absorb if you are thinking about buying or selling property or land on Martha's Vineyard this coming year.
MARTHA'S VINEYARD 2017 REAL ESTATE MARKET REVIEW
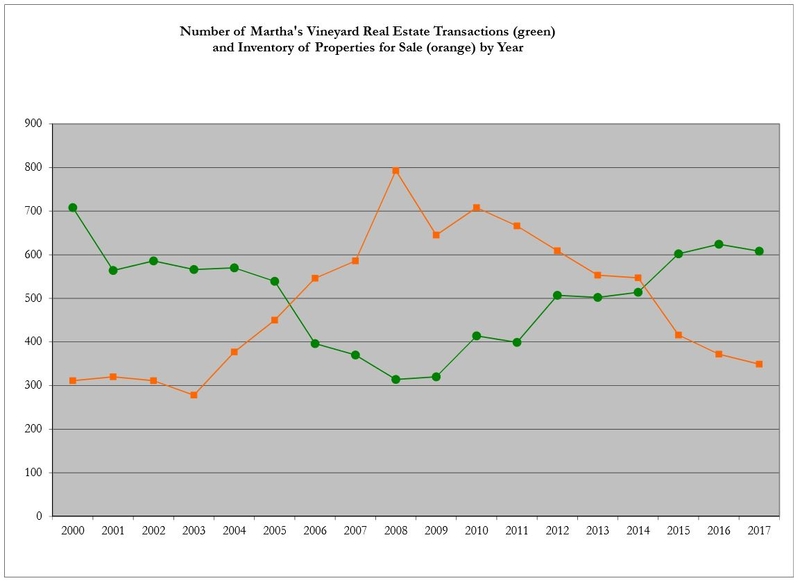
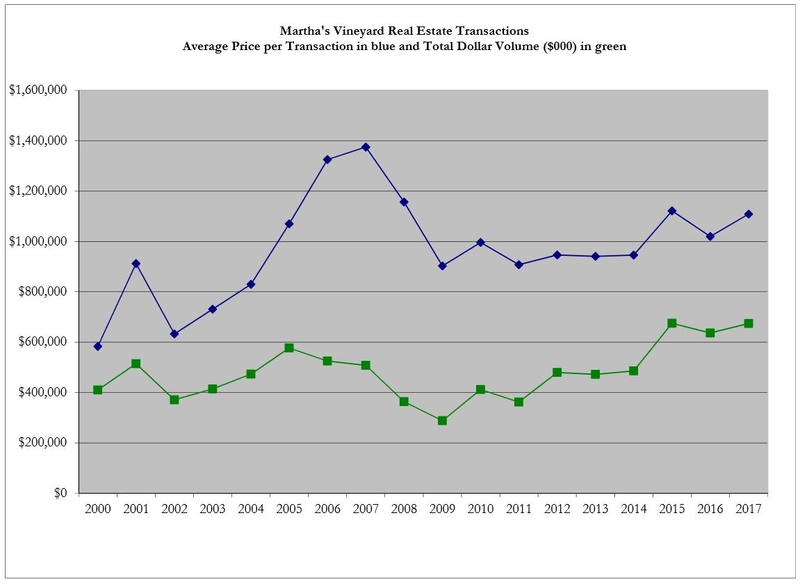
2017 was a strong year for Martha’s Vineyard real estate and solidified our position at the record high level of activity that was established in 2015, sustained in 2016 and held again in 2017. Although, the number of transactions slipped slightly in 2017, a 2.6% decrease to 608 sales, total dollar volume rose 5.9% in 2017 to $674mm, and average sales price rose 8.7% to $1.1mm. This is the third consecutive year of sustained activity at a level above 600 sales and $630mm dollar volume. This consistency in the market in 2017 confirms our stability at this new high plateau.
The Martha’s Vineyard real estate market grew tremendously in 2015 and it’s worth looking at the last three years in a snapshot: total sales fluctuated from 602 (2015) to 624 (2016) to 608 (2017), and dollar volume moved from $675mm (2015) to $636mm (2016) to $674mm (2017).
In 2016 we wondered if the market could keep pace with the dramatic uptick that occurred in 2015, and the 2016 market proved to sustain that 2015 growth except for the high end over $10mm. Even though 2016 was a record-breaking year for the number of transactions, with the lack of sales over $10mm, total dollar volume for the market slipped in 2016. 2017 saw the return of the market over $10mm, dollar volume kept pace with 2015 and average price bumped up accordingly.
The significant factor affecting prices in 2017 was a continued decline in peak inventory level. The inventory level fell for the seventh consecutive year, a decline of 6% from 372 in 2016 to 349 in 2017. This is the third straight year that peak inventory level is lower than the number of transactions for the year. This dynamic has created a landscape of competitive bidding and shorter time on market for properties in the most popular niches of the island real estate market.
While the above statistics include all transactions and represent island-wide performance, individual towns and market segments reveal different dynamics in 2017. Martha’s Vineyard is an island with six towns, each with its own character and specific market conditions. Within each town there are different niches as well…waterfront, water view, high-end, mid-range, entry level and commercial properties. Generalizing trends or making broad statements can be difficult because each market segment can be, on its own, very small. However, it is worth diving in to the different towns and niches to understand their role in the overall market performance.
UP ISLAND
After Chilmark’s surge in 2016, the 2017 market here kept pace in terms of number of transactions, from 55 in 2016 to 56 in 2017, but total dollar volume in Chilmark fell 15% from $116mm in ’16 to $99mm in ’17. Therefore, average price dropped as well, a 16% decrease from $2.11mm in ’16 to $1.76mm in ’17. Digging into these numbers, the level of activity below $1mm was flat from ’16 to ’17 at 23 sales both years. It was the high end over $5mm that experienced a slowdown in 2017 causing the overall drop in dollar volume. In 2017, there were only 4 sales over $5mm, versus 9 sales in 2016.
The cyclical nature of our second home market may explain the more modest high end activity in Chilmark in 2017 (after a very strong year in 2016). A year of reduced (or increased) activity in a specific town or market niche is not the same as an overall trend. Buyers often look for several years before finding the right property and, in a market where just a few sales can make a difference, this rhythm is reflected in the statistics. A backlog of active buyers (or a surplus in inventory) can cause an increase in transactions one year and, once they buy, a decrease the next.
Chilmark represented 9% of total transactions on the island and 15% of total dollar volume on the island in 2017. It is a small market of high-end properties where a few sales can make an impact. In 2017, one of the two sales on the island over $10mm was located on the north shore of Chilmark: a 1920s home on the Vineyard Sound with 7 bedrooms on 18.5 acres in a private association sold for $11.75mm. The other three sales over $5mm in Chilmark were: 1) a 23-acre property with four-bedroom home on Squibnocket Pond for $7.4mm, 2) a 3.4-acre property with house, guesthouse and private path to ocean beach for $6.225mm, and 3) a 2-acre property with 5+ bedroom move-in ready home, pool, pool house, and deeded ocean beach for $6.075mm.
West Tisbury had a slower year in 2017 compared to its strong numbers in 2016. The total number of transactions fell 5.6% to 67 (from 71 in ’16). Total dollar volume dropped 5.8% to $68mm (from $73mm in ’16). Average price grew slightly, 1.3% higher at $1.04mm (from $1.02mm in ’16). This news isn’t all bad because 2016 was a growth year for West Tisbury and the 2017 activity outpaced the town’s performance in each of the three years prior to 2016.
In 2017, West Tisbury represented 11% of total transactions on the island and 10% of dollar volume island-wide.
Aquinnah had a strong year in 2017. This smallest market on the island represented 3% of total island-wide transactions and dollar volume. In 2017, the total number of transactions grew by 1 sale (from 16 in ’16 to 17 in ’17) which translates to a 6% increase. Total dollar volume grew 23% (from $15.4mm in ’16 to $18.9mm in ’17) and average sales price rose 15% (from $963k in ’16 to $1.11mm in ’17). The growth in dollar volume and average price was due to high-end sales over $2mm. There were 4 sales over $2mm in 2017 versus none in 2016.
DOWN ISLAND
Edgartown is the largest market on the island with the most expansive price range, and it posted the most growth in 2017. The total number of transactions in Edgartown grew 8% from 182 in 2016 to 197 in 2017. Total dollar volume increased 27% from $222mm in 2016 to $282mm in 2017. Average price grew 17.5% from $1.22mm in 2016 to $1.43mm in 2017. These gains of 2017 prove the health of the Edgartown market as they regain some of the lost ground between the record break performance of 2015 and the slowdown of 2016.
Both the high and low ends of the Edgartown market grew in 2017. There were 121 sales under $1mm in 2017 (versus 109 in 2016) and there were 9 sales over $5mm in 2017 (versus just 2 in 2016). One of the two sales over $10mm on the island in 2017 was a harborfront property in Edgartown. This was a 3.4 acre property with a 5400+ square foot, 9-bedroom home, pool, pool house and deep water dock on Edgartown harbor which sold for $20.5mm.
In 2017, Edgartown’s activity represented 32% of total number of transactions on the island and $42% of total dollar volume island-wide.
Oak Bluffs had the weakest performance in 2017 with the number of transactions falling 12.5% from 160 in 2016 to 140 in 2017 and total dollar volume decreasing 9.3% from $106mm in 2016 to $96mm in 2017. Despite these declines, average price increased 3.7% from $662k in 2016 to $687k in 2017. The increase in average price is due to fewer sales under $1mm in 2017. The missing 20 sales in 2017 came from the under-$1mm segment (there were 138 sales under $1mm in ’16 and 118 sales under $1mm in ’17).
Oak Bluffs represented 23% of total transactions on the island in 2017 and 14% of total dollar volume island wide.
Tisbury (Vineyard Haven) posted mixed results in 2017. Total number of transactions fell 6.4% (from 140 in ’16 to 131 in ’17) but total dollar volume rose 3.9% (from $104.4mm in ’16 to $108.5mm in ’17) and average price climbed 11% (from $746k in ’16 to $828k in ’17). This increase in dollar volume and average price was due to an increase in sales between $1mm and $2mm, as well as a decline in the activity below $1mm. In 2017 there were 107 sales under $1mm (versus 118 in ’16) and 18 sales between $1mm and $2mm (versus 14 in ’16).
Tisbury activity in 2017 represented 21% of total transactions on the island and 16% of total dollar volume island wide.
ENTRY LEVEL SALES
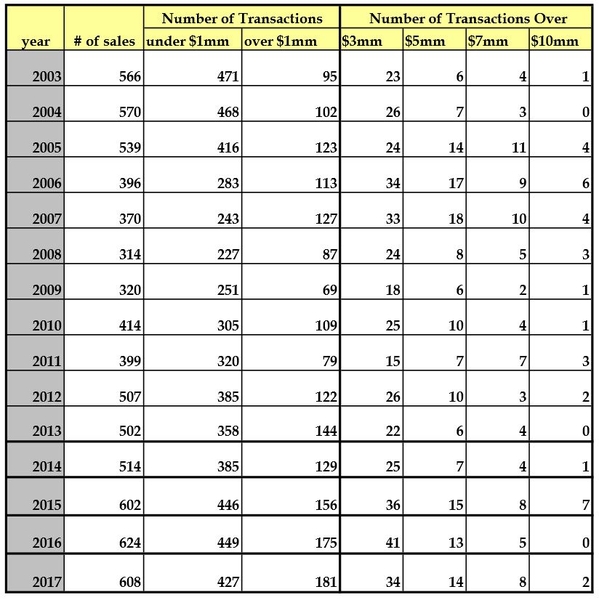
Last year we discussed the slowing down of the market under $1mm and that rising prices were taking properties over the $1mm mark. This trend continued in 2017 and the number of sales under $1mm dropped to 427 sales (versus 449 in ’16). It became harder to enter the Vineyard market in 2017. This segment of the market under $1mm had been growing consistently over the last decade with increased transactions each year (except 2013) making it easier to enter the market year after year. Over the past 10 years the number of transactions under $1mm grew from 227 in 2008 to the peak of 449 in 2016. This dynamic shifted in 2017. Foreclosures had an impact on the numbers in this market segment prior to 2013 but fortunately since then, the number of foreclosures has fallen off dramatically. The number of foreclosures fell again last year to 9 total island wide (from 18 in ’16).
HIGH END SALES
Sales over $1mm climbed slightly in 2017 to 181 (from 175 in ‘16) and the strongest segment was the $1mm-3mm range where there was a 10% increase in activity (from 134 transactions in ’16 to 147 in ’17). The high-end over $5mm had a solid performance in 2017. Although sales over $5mm slipped a bit from 41 in ’16 to 34 in ’17, sales over $7mm doubled (from 5 in ’16 to 10 in ’17) including two sales over $10mm which brought back this segment of the high-end market in 2017 which was non-existent in 2016.
Looking at the three-year period between 2015-2017, the high end market was strong, but the highest end niches have not reached the level of the real estate market peak of 2005-2007. Between 2015-2017 there were 9 sales over $10mm (a decline from 14 sales between 2005-2007), 21 sales over 7 million (a decline from 30 sales between 2005-2007) and 42 sales over $5mm (a decline from 49 sales between 2005-2007). This is in contrast to 111 sales over $3mm between 2015-2017 (an increase from 91 sales between 2005-2007) and 512 sales over $1mm (an increase from 363 sales between 2005-2007).
LAND SALES Vacant land sales represented 9% of total sales on the island in 2017 at $61mm. This was a 10% decrease in dollar volume for land sales compared to 2016 ($68mm) and a 12% drop in the number of transactions from 113 in 2016 to 99 in 2017. These numbers include the sale of unbuildable beach lots. There were 8 beach lots sales in 2016 (all in Chilmark) and 5 beach lots sold in 2017 (4 in Chilmark, 1 in Aquinnah).
Looking at buildable parcels, the average price rose 2% in 2017 from $624k in 2016 to $636k in 2017. While the total number of land sales slowed a bit, both Chilmark and Aquinnah experienced an uptick in buildable land sales in 2017. Chilmark had 11 buildable land sales in 2017 (versus 6 in ’16) and Aquinnah had 4 buildable land sales in 2017 (versus 3 in ’16). Chilmark had the highest average price for a parcel of buildable land at $1.39mm and Tisbury had the lowest average price at $302k in 2017.
There were 6 buildable land sales over $2mm in 2017 (up from just 3 sales over $2mm in 2016.) Of these 2017 sales, the highest was $6.6 mm for 139 Meetinghouse Way, a 55-acre parcel in Edgartown. The other 5 sales were between $2mm and $3mm, with 4 of these sales occurring in Chilmark and 1 in West Tisbury.
COMMERCIAL SALES The sale of commercial properties declined to 13 in 2017 (down from 20 transactions in 2016). These sales were split almost equally among the three down island towns: 4 in Edgartown, 4 in Oak Bluffs and 5 in Tisbury. The largest brokered commercial real estate transaction in 2017 was the sale of 44 Main Street in Tisbury (former home of Bunch of Grapes bookstore and Midnight Farm, now Vineyard Vines). This is a 5200 square foot anchor business space in downtown Vineyard Haven which sold for $1.275mm.
CONCLUSION The short-term look at the 2017 numbers paints a picture of a relatively steady market year to year, with lower inventory putting pressure on prices. But the bigger picture tells a more compelling story. 10 years after the economic downturn (2008), the island’s real estate market has climbed to a new plateau and is solidly planted there after three consecutive years at this new high level of activity and dollar volume. Some segments of the market have shifted to a “seller’s market” and prices are rising, but buyers should not be discouraged because most asking prices are still expected to be negotiated and average “days on market” continues to be longer than most primary home markets at 180 days.
In most respects the market has fully recovered from the economic downturn. The number of real estate transactions between 2015-2017 was higher than during the market peak of 2005-2007 and the total dollar volume of sales reached record highs.
The Martha’s Vineyard real estate market is thriving even amongst the turmoil in the world and the divisive political landscape in our country, or maybe because of these things. The Vineyard has always been and remains a respite from chaos, and a sacred place to slow down and focus on time with family, friends, community, or by oneself.