Have a Question?
Market Report
Martha’s Vineyard Real Estate Market Update is a service offered by Tea Lane Associates. Tea Lane Associates updates Martha's Vineyard real estate sales transactions on a weekly basis and posts reports and charts throughout the year for your review, including info on all homes and land sales on the island. Please let us know if you have any questions or would like more detailed analysis for properties in a specific town or price range. We have much more information to share with you on the Martha's Vineyard Real Estate market.
2025 MARKET REVIEW | KEY MARKET STATISTICS | 2025 TEA LANE HIGHLIGHTS
RECENT NEWS
| 5/4/26 | 24 Robins Nest Rd | Edgartown | $700,000 | Medeiros | Barton |
| 5/4/26 | 38 Rogers Way | Oak Bluffs | $1,450,000 | Lowe | Donahue |
| 5/6/26 | 34 Davis St | Tisbury | $1,935,000 | McElhinney | Maney |
| 5/7/26 | 55 Farm Pond Rd | Oak Bluffs | $766,667 | Lehmann | Birch |
| 5/7/26 | 52 Windsor Dr | Edgartown | $1,125,000 | Panico | Bicknell |
| 5/8/26 | 25 Bold Meadow Rd | Edgartown | $3,381,000 | Soldini | 25 Bold Meadow Rd Nom Tr |
| 5/8/26 | 18 Windsor Dr | Edgartown | $1,150,000 | Saucier | 18 Windsor LLC |
Martha’s Vineyard 2025 Real Estate Market Review
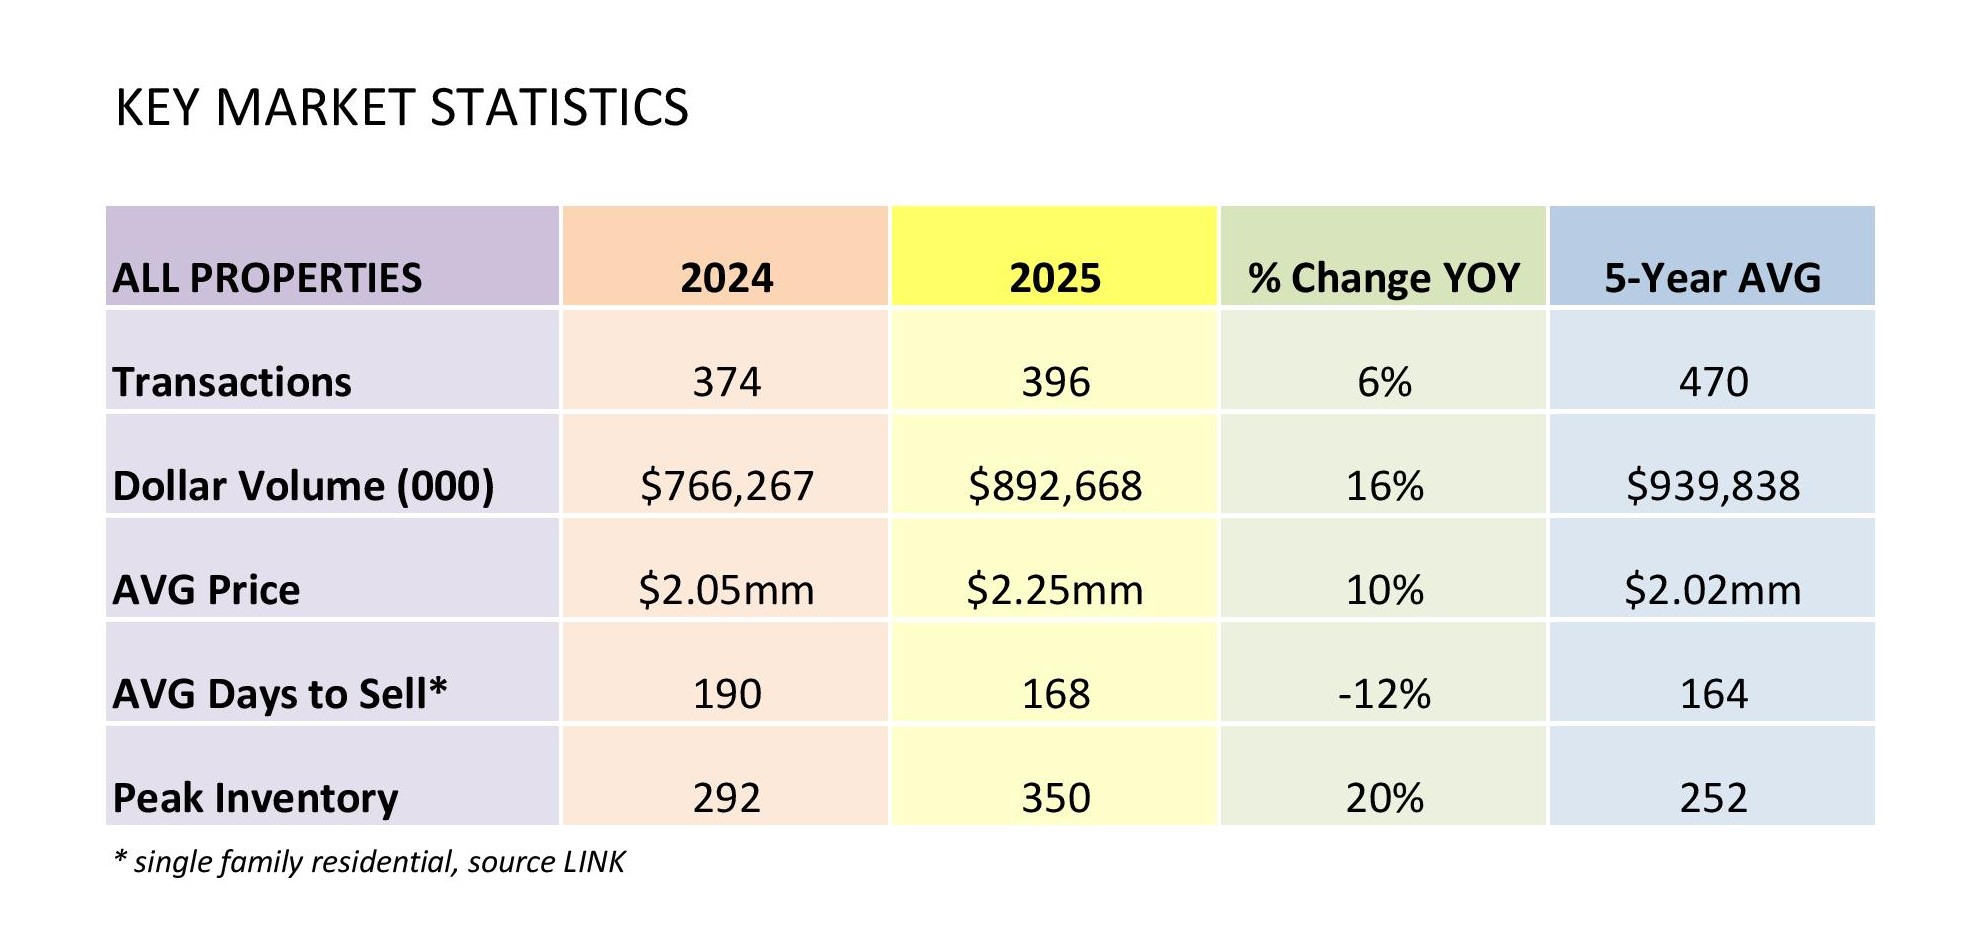
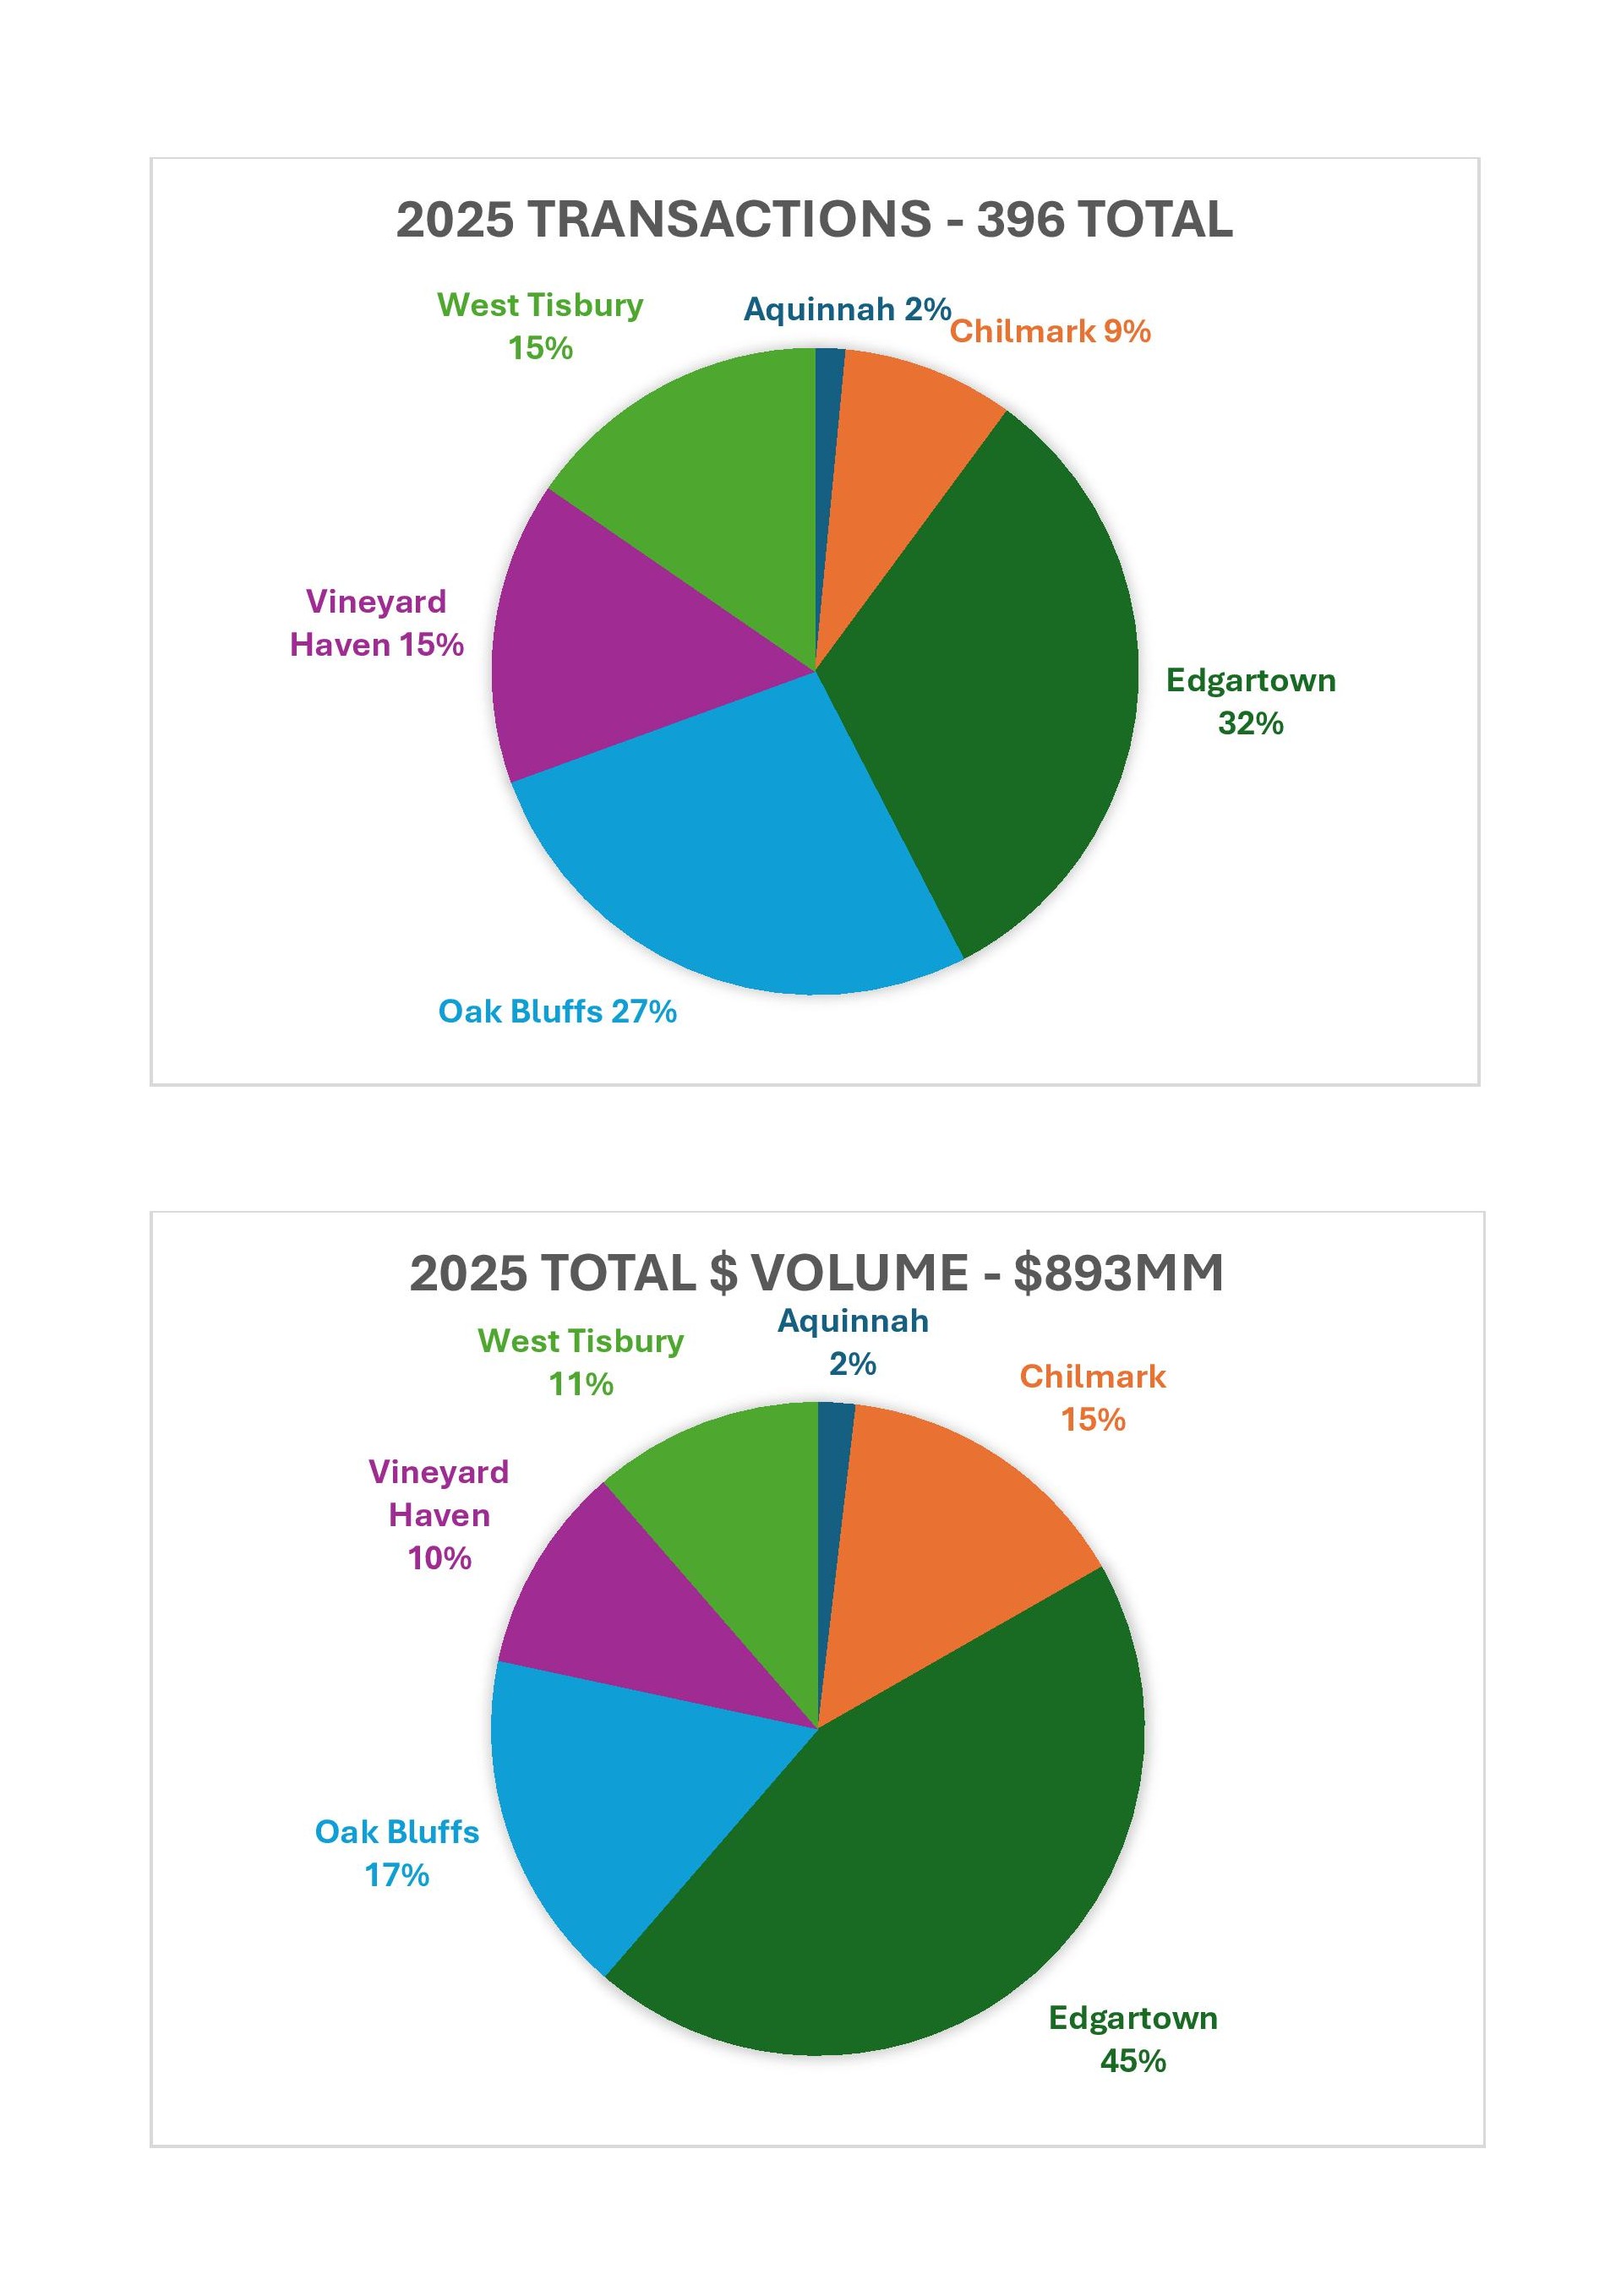
The Martha’s Vineyard real estate market strengthened in 2025. The number of total transactions rose 6% from 374 transactions in 2024 to 396 in 2025. Dollar volume increased 16% from $766mm in 2024 to $893mm in 2025. Average price increased 10% from $2.05mm in 2024 to $2.25 in 2025.
For broader perspective on these numbers, 2025, with 396 transactions, was the second lowest activity year since 2009 for Martha’s Vineyard. However, 2024 was the lowest, so the 2025 numbers represent healthy growth in activity. Meanwhile, the dollar volume of $893mm is the third highest level of dollar volume, behind only the two COVID spike years of 2020 and 2021. Accordingly, average price continued to climb to another record setting high level in 2025 of $2.25mm across all properties and $2.47mm for residential properties.
Residential sales in 2025 accounted for 91% of overall market dollar volume and 83% of transactions. Looking at residential properties specifically (including condo sales), transactions and dollar volume in this category grew more than the overall market. The number of transactions increased 8% and dollar volume jumped 23%. Average price of residential properties grew dramatically, 14% from $2.176mm in 2024 to $2.47mm in 2025. However, removing the two highest sales of the year at $37+mm from the equation (these are discussed below in the High End Sales section), the average price for residential properties rose a more modest 4% to $2.26mm. Median price increased 3% from $1.555mm in 2024 to $1.60mm in 2025 with or without those two highest sales.
PRICING TRENDS AND INVENTORY
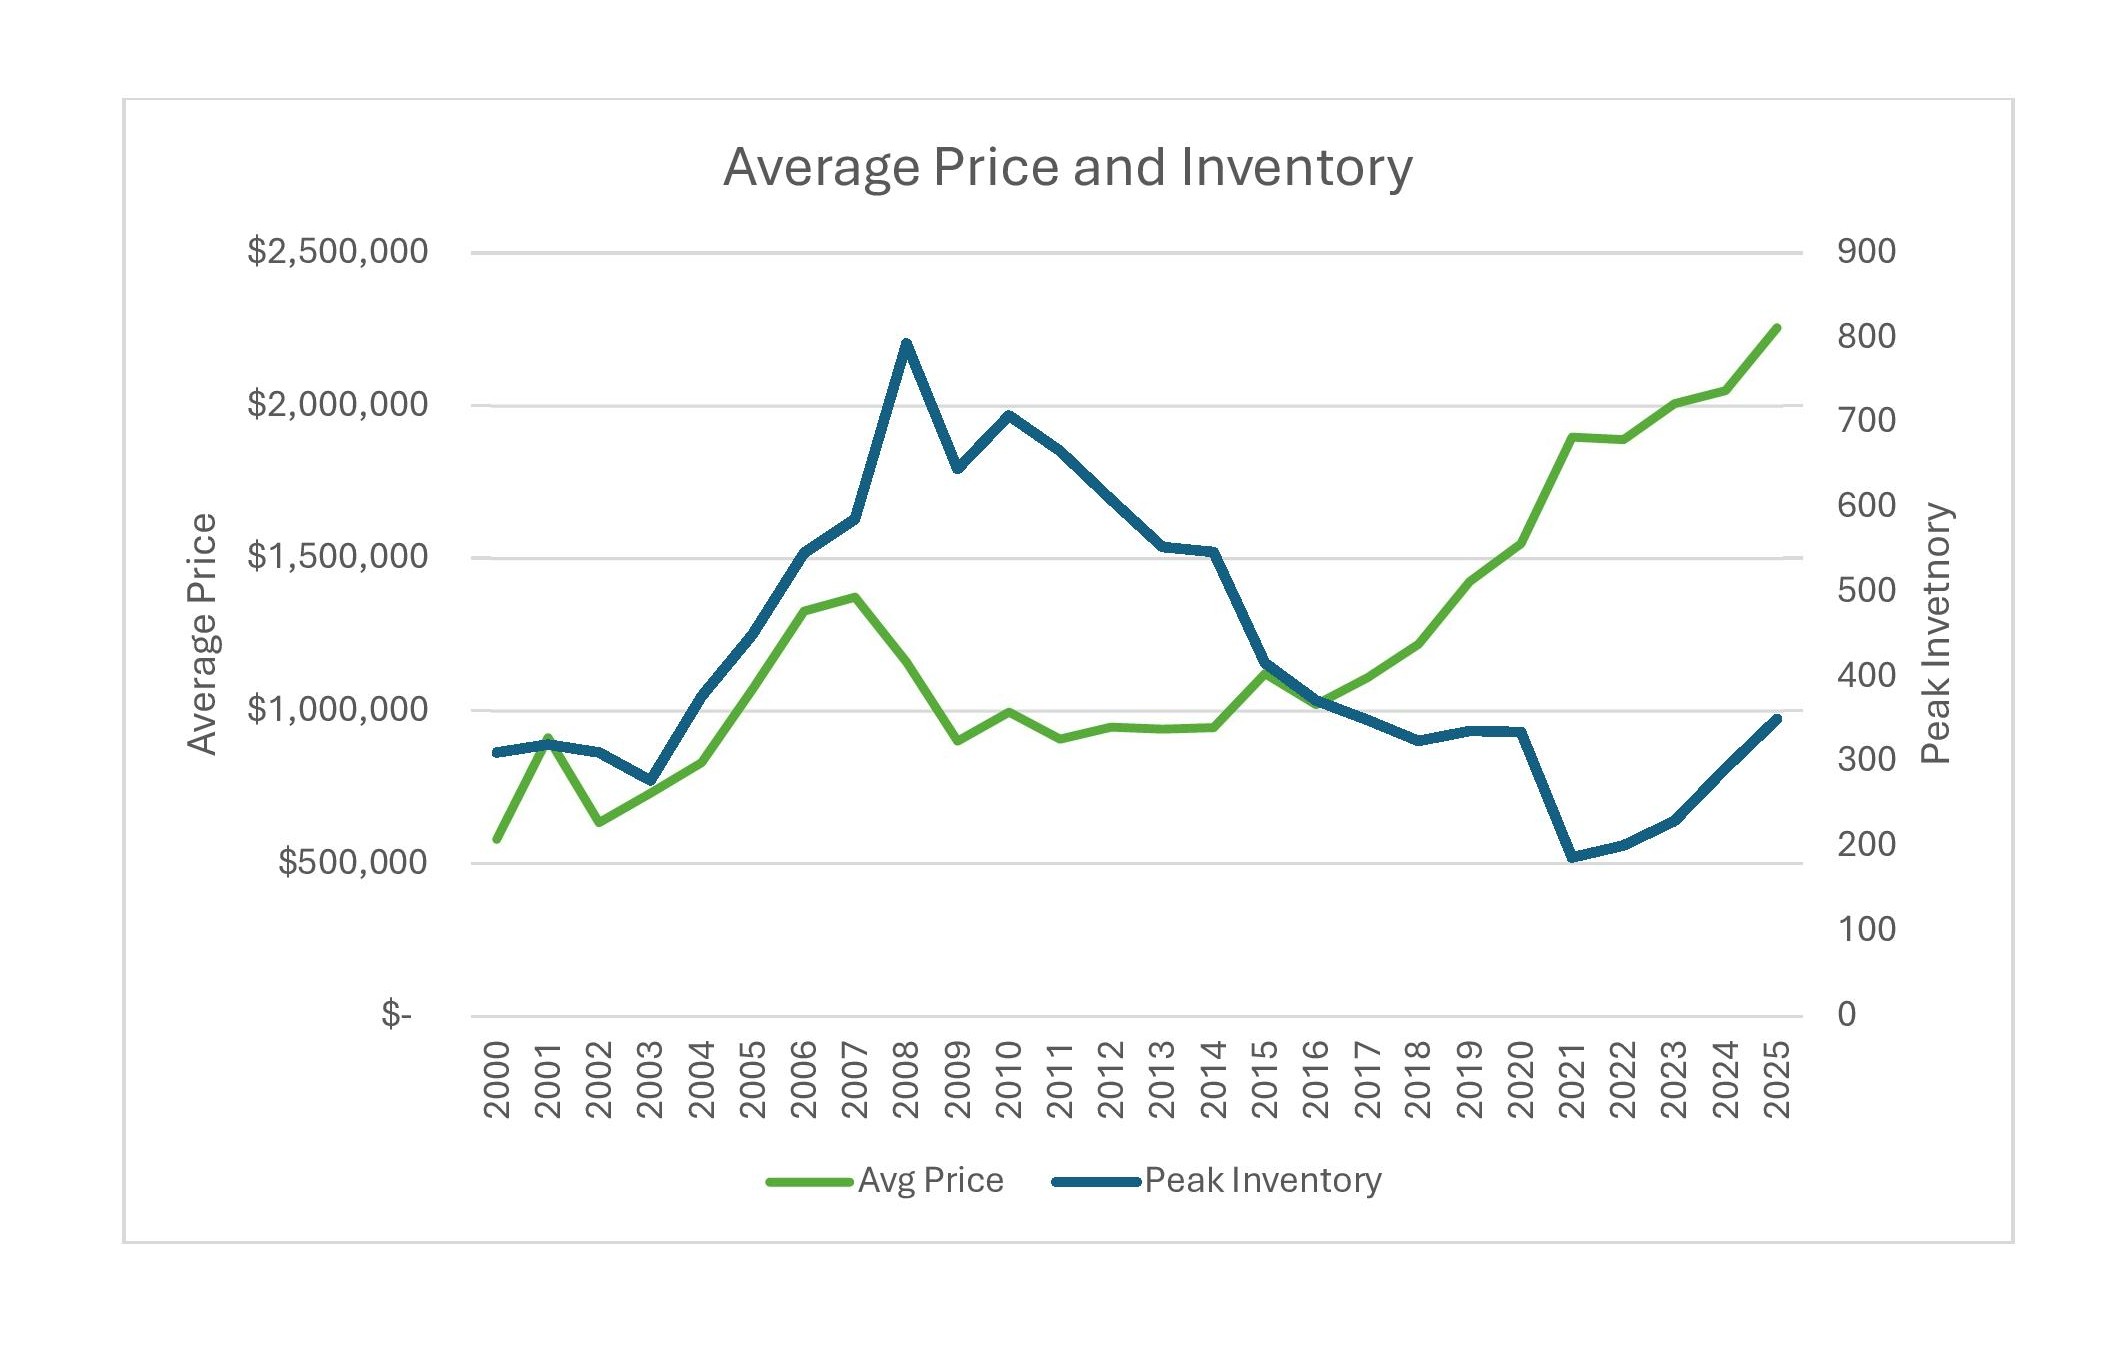
While activity was relatively slow but steady in 2025, average price continued its upward march to a new all-time high. Residential property pricing in 2025 was 53% higher than pre-COVID (average price for residential property in 2019 was $1.614mm, compared to $2.47mm in 2025). Last year we thought 2024’s flat pricing was signaling a potential softening in prices, but 2025 proved that market demand is still strong and prices continued to push higher.
The peak inventory level climbed 20% to 350 properties in 2025. After several years of scarcity, there was a general feeling on the island in the summer of 2025 that there were a lot of properties on the market and the 2025 results show the market returned to a pre-COVID inventory level similar to 2017 when the peak inventory was 349 properties. However, this rebound in inventory has not (yet) dampened prices.
While the above statistics include all transactions and represent island-wide performance, individual towns and market segments reveal different dynamics. Martha’s Vineyard is an island with six towns, each with its own character and specific market conditions. Within each town there are different niches as well…waterfront, water view, high-end, mid-range, entry level and commercial properties. Generalizing trends or making broad statements is challenging because each market segment can be, on its own, very small. However, it is worth diving into the different towns and niches to understand their role in the overall market performance.
Chilmark posted 34 transactions in 2025, a 55% increase from 2024 which had 22 transactions and had been flat for a couple of years (2023 had 23 transactions and 2022 had 22). This is a positive jump in activity after three quiet years for the town – 2022 to 2024 were the slowest activity years since 2009 and this sluggishness was attributed to a lack of inventory. Consistent with the jump in activity in 2025, Chilmark’s inventory grew significantly in 2025 from a peak of 27 properties in 2024 to 47 in 2025. This is up from a low of 10 properties in 2022.
Dollar volume in Chilmark grew 130% in 2025, from $58mm in 2024 to $133mm in 2025. Average price per transaction increased 49% from $2.63mm in 2024 to $3.91mm in 2025. The dramatic jump in dollar volume and average price is due to a handful of high-end sales (5 sales) over $7mm, two of which were $15mm+ and one of which was $37mm. The $37mm sale was the sale of Blue Heron Farm on the Tisbury Great pond. It was the second highest sale on the island in 2025 and is discussed further in the “High-End Sales” section below.
Looking at Chilmark’s price segments specifically, the high end over $3mm had 11 sales in 2025, compared to only 7 in 2024. Activity in the $1-3mm range was steady at 11 sales in 2025 compared to 10 in 2024. In 2025, there were 11 transactions under $1mm, 8 of which were beach lots and 3 were land sales. There were no residential sales under $1mm.
In 2025, Chilmark sales represented 9% of transactions and 15% of dollar volume island-wide. The average home sale price in 2025 in Chilmark was $6.435mm, the highest of all the towns on the island for the year.
West Tisbury transactions increased 42% from 43 transactions in 2024 to 61 in 2025. Dollar volume grew 18% from $86mm in 2024 to $101mm in 2025 but the average sales price in the town was down 17% from $1.995mm in 2024 to $1.660mm in 2025.
The average price dropped due to the largest growth in the West Tisbury market coming from the mid-range segment of $1-3mm. This segment grew from 33 sales in 2024 to 48 in 2025. The high-end over $3mm held steady at 5 in 2024 and 2025.
In 2025, West Tisbury sales represented 15% of all transactions on the island and 11% of dollar volume. The average home sales price in West Tisbury in 2025 was $1.797mm.
Aquinnah posted decreases in the number of transactions and dollar volume in 2025 but an uptick in average price. Transactions were down 33% from 9 in 2024 to 6 in 2025 and dollar volume declined 14% from $19mm in 2024 to $17mm in 2025. However, due to all but one sale being over $2mm, average price grew 29% from $2.16mm in 2024 to $2.78mm in 2025.
There were no land sales in Aquinnah in 2025. All sales were residential, two of which were camps (at $749k and $2.75mm). Of the four year-round homes sold, prices ranged from $2.12mm to $4.00mm.
This smallest market on the island represented 1.5% of total island-wide transactions and 2% of total island-wide dollar volume. The average home sale price in Aquinnah in 2025 was $2.78mm, the third highest behind Chilmark and Edgartown.
Edgartown’s activity was flat in 2025 but the town posted increases in dollar volume and average price. There were 128 transactions in Edgartown in 2025, essentially flat from 129 in 2024 (and 128 in 2023). Meanwhile total dollar volume grew by 11% from $358mm in 2024 to $398 in 2025. Average price grew similarly 12% from $2.77mm in 2024 to $3.11mm in 2025.
High-end sales of $10mm+ in Edgartown bounced back from 3 transactions in 2024 to 6 in 2025 (there had been 6 sales in this price range in 2023 as well). The segment of $3-10mm slowed a bit from 41 transactions in 2024 to 35 in 2025. Edgartown’s $1-3mm market remained steady at 70 sales in both 2024 and 2025.
Edgartown recorded the highest real estate transaction on the island in 2025 – the $37.5mm sale of a harborfront home with dock which is discussed further in the “High End Sales” section below. The town also posted the highest land sale of $5mm for 4 acres with a barn on Oyster Pond.
Edgartown sales represented 32% of transactions and 45% of total dollar volume island-wide in 2025. The average home sale price in Edgartown in 2025 was $3.35mm, the second highest on the island.
Oak Bluffs recorded a strong performance in 2025. The number of transactions increased 12% from 96 in 2024 to 107 in 2025, dollar volume grew 19% from $128mm in 2024 to $152mm in 2025, and average price ticked up 7% from $1.33mm in 2024 to $1.42mm in 2025. Oak Bluffs posted the highest commercial transaction on the island in 2025, the sale of a mixed used building (restaurant and apartments) on Circuit Ave for $4,950,000.
The gains in activity in Oak Bluffs in 2025 were spread across all price points. There were 44 sales under $1mm in 2025 versus 39 in 2024. There were 56 sales in the $1-3mm range in 2025 versus 52 in 2024. There were 7 sales in 2025 in the $3mm+ range versus 5 in 2024.
Oak Bluffs’ transactions represented 27% of transactions on the island in 2025 and 17% of dollar volume. The average home sale price in Oak Bluffs in 2025 was $1.38mm, which is the lowest of all the towns.
Tisbury reported declines across the board in 2025. There was a 20% decline in the number of transactions from 75 in 2024 to 60 in 2025 and a 22% decrease in dollar volume from $118mm in 2024 to $92mm in 2025, but a more moderate 3% drop in average price from $1.57mm in 2024 to $1.53mm in 2025.
High-end sales in the $3mm+ segment grew modestly from 4 sales in 2024 to 6 in 2025. One of these, the sale of a beautifully renovated 1880 home with pool on William Street for $4.295mm was a record price for this historic area. Meanwhile, the mid-range segment took a hit in 2025 with just 35 sales in the $1-3mm range, down 20% from 44 in 2024.
Tisbury represented 15% of transactions and 10% of dollar volume island-wide in 2025. The average home sale in Tisbury in 2025 was $1.67mm.
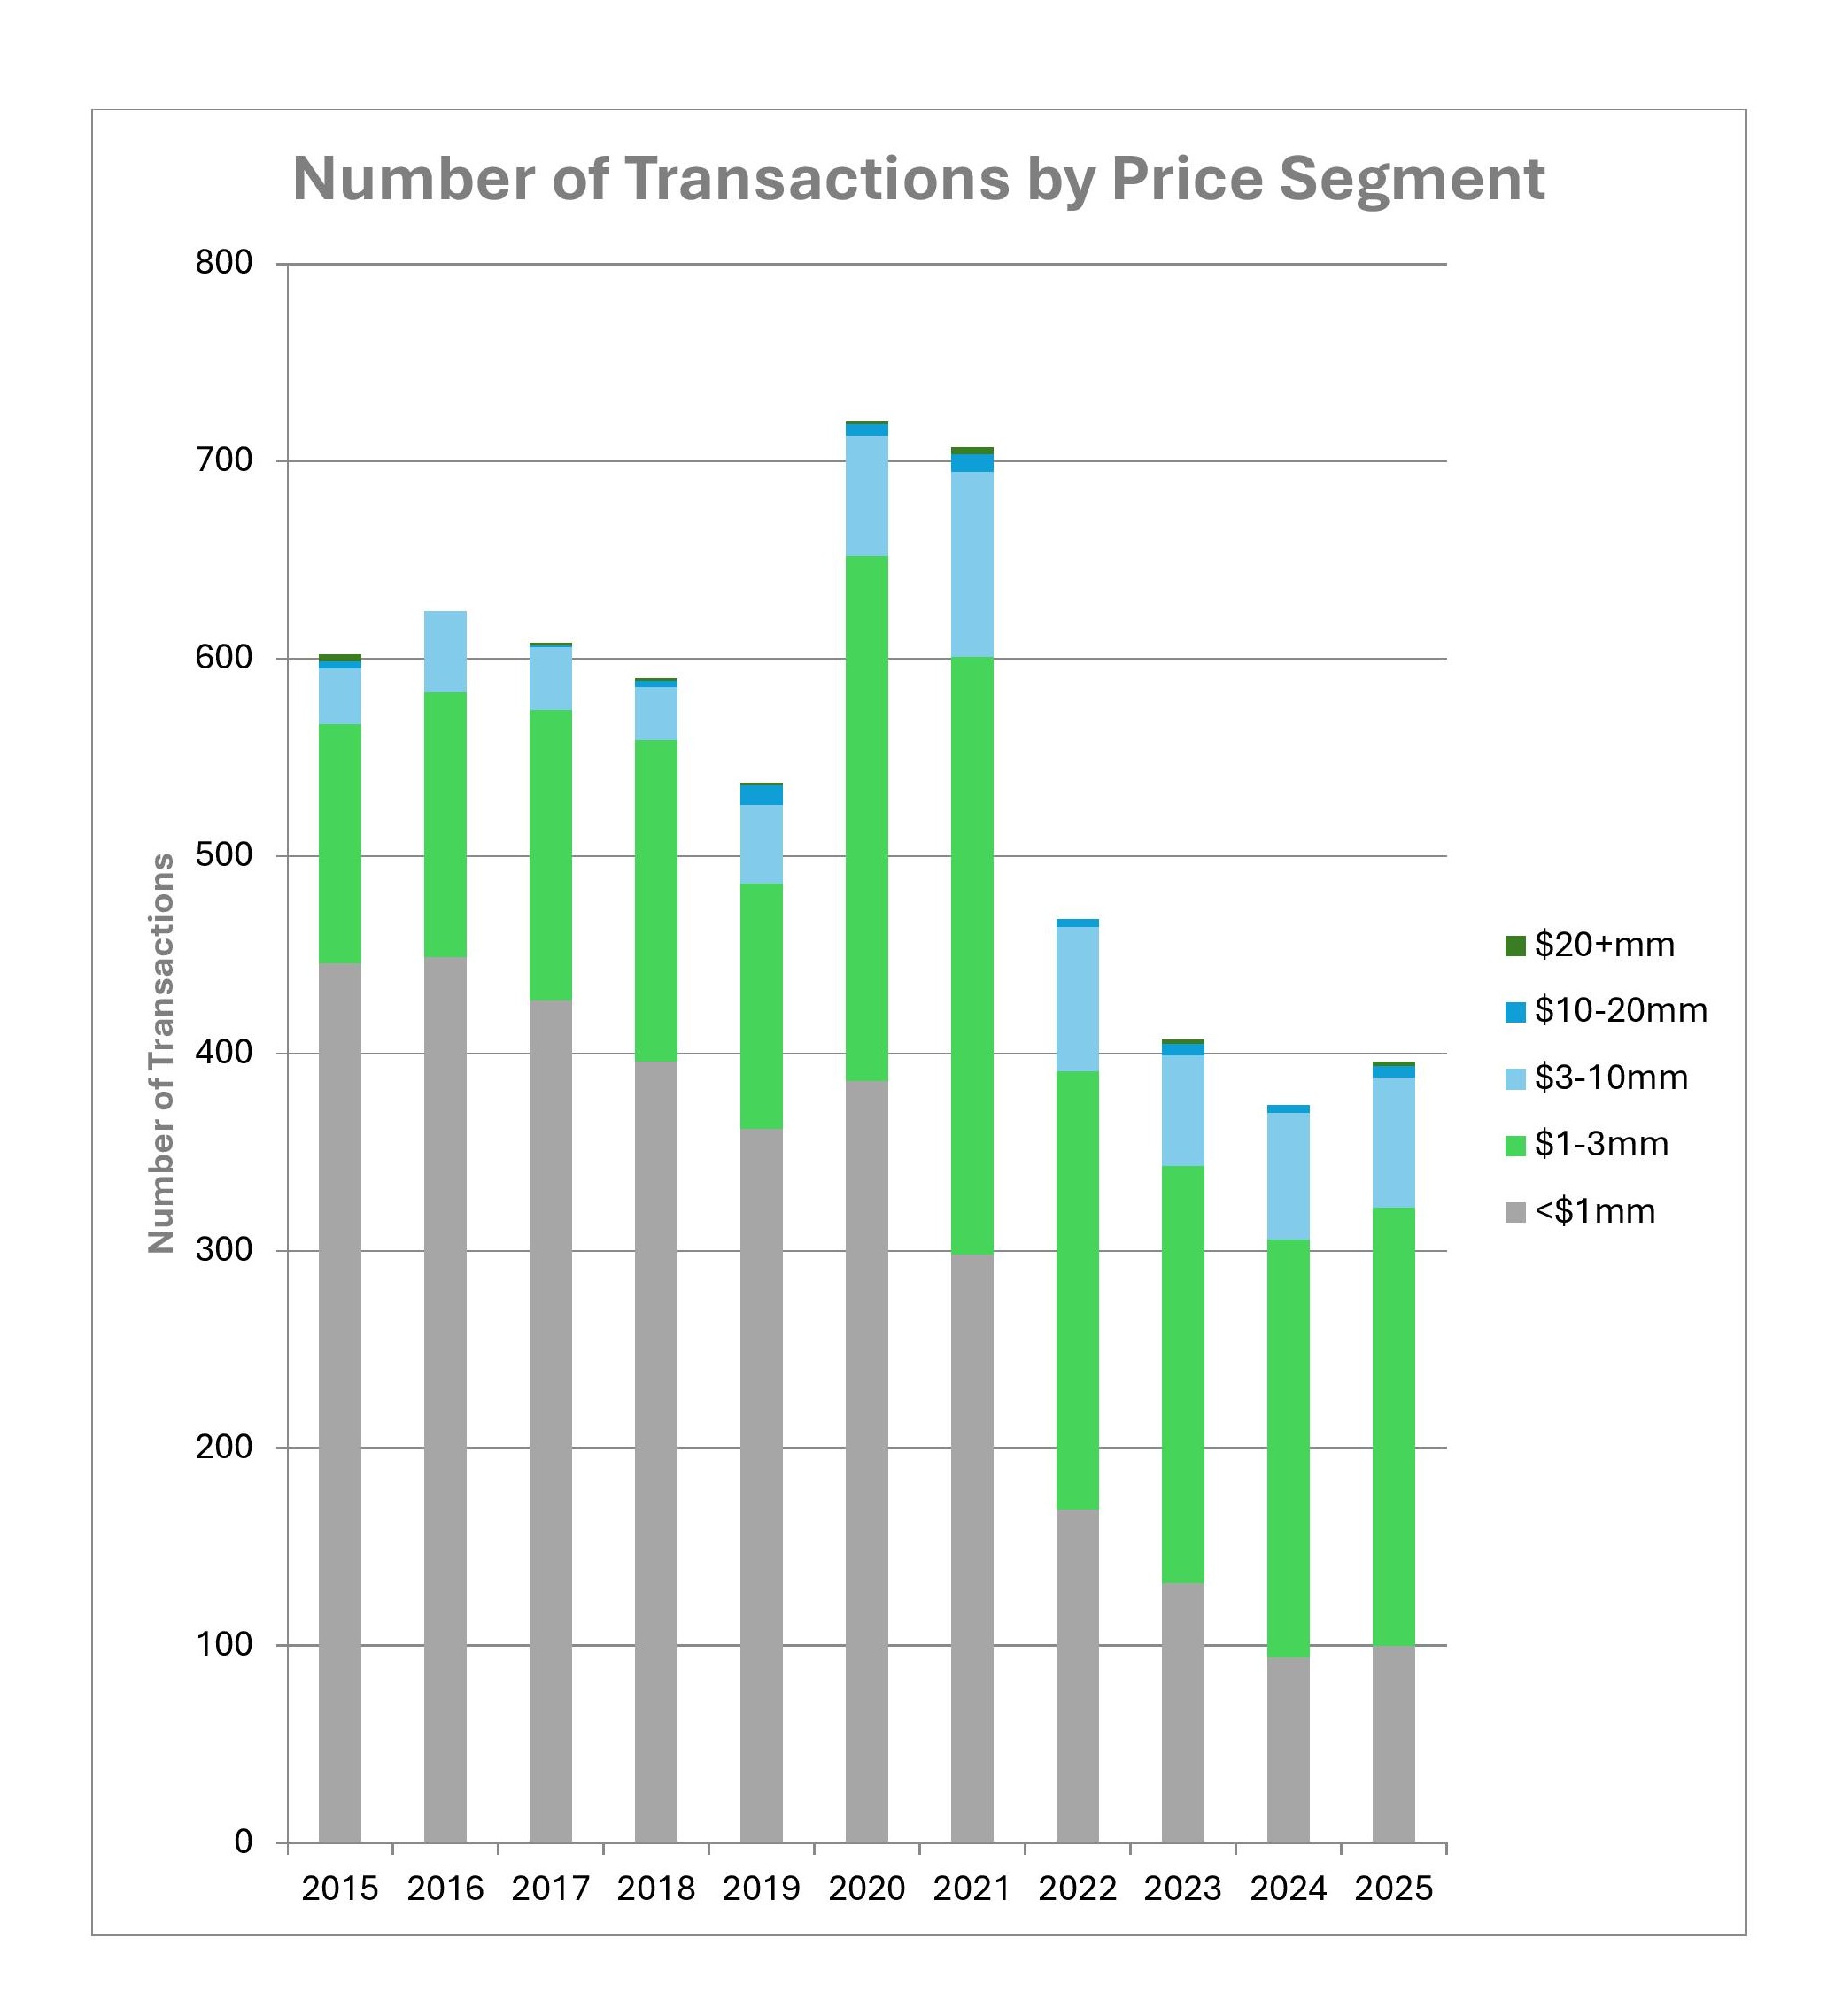
The number of sales in the entry level segment of the market, all sales under $1mm, has declined every year since 2016 except for 2020 when it ticked up slightly, and 2025 was another uptick year for the entry level market. Although modest, the total number of sales under $1mm increased from 94 in 2024 to 100 in 2025. This segment of the market has been decreasing over the years, from a market share of 42% of all transactions in 2021 to 36% in 2022 to 32% in 2023 and down to 25% in 2024. The 2025 market share for the entry level held steady at 25%. For buyers in this segment, including local families and service workers, the 2025 results are somewhat hopeful but it continues to be very difficult to enter the island real estate market.
As in many resort communities, the Vineyard has been actively trying to address the housing crisis for the workforce and local families. A variety of businesses, restaurants and essential services are critical to a healthy community and local economy but these amenities are difficult to sustain due to labor shortages. Local individuals, governments and organizations continue to chip away at this monumental issue, changing zoning by-laws, increasing rent subsidies and building new affordable housing.
In 2023, we wrote about the Coalition to Create an MV Housing Bank Coalition to Create the MV Housing Bank and last year we covered the new Affordable Homes Act for Massachusetts which included the designation of the Vineyard as a “seasonal community” and included the right to build Accessory Dwelling Units by right Accessory Dwelling Units | Mass.gov. These are all positive steps forward to start addressing the island’s housing issue in a meaningful way. However, more action is necessary to truly make a difference.
In October of 2025 a tailored piece of legislation, allowing for a transfer fee on real estate sales on the Cape and Islands went before the state legislature. If it passes it will allow seasonal communities to assess and implement transfer fees with the proceeds to fund affordable housing initiatives. The Vineyard Gazette reported, “Under the bill, towns would have to vote to adopt the transfer fee, which would be paid for by the buyer when closing on a home. The rate could be between 0.5 per cent and 2 per cent and would be only applicable to the portion of a sale price above the exemption threshold – another key difference from the past attempts to pass the bill.” A vote on this legislation is not expected until early 2026.
High-end sales ($3+mm) were strong on Martha’s Vineyard in 2025 and their dollar volume outpaced other segments of the Vineyard market. The Wall Street Journal reports “In 2025, the U.S. housing market continued to be mired in a slump, with sales volume stuck at its lowest point in decades and affordability out of reach for many buyers. But at the ultra high-end of the market, a very different narrative unfolded: Ultraluxury real estate sales, which have boomed in much of the country for the last few years, got even stronger.” (January 29, 2026).
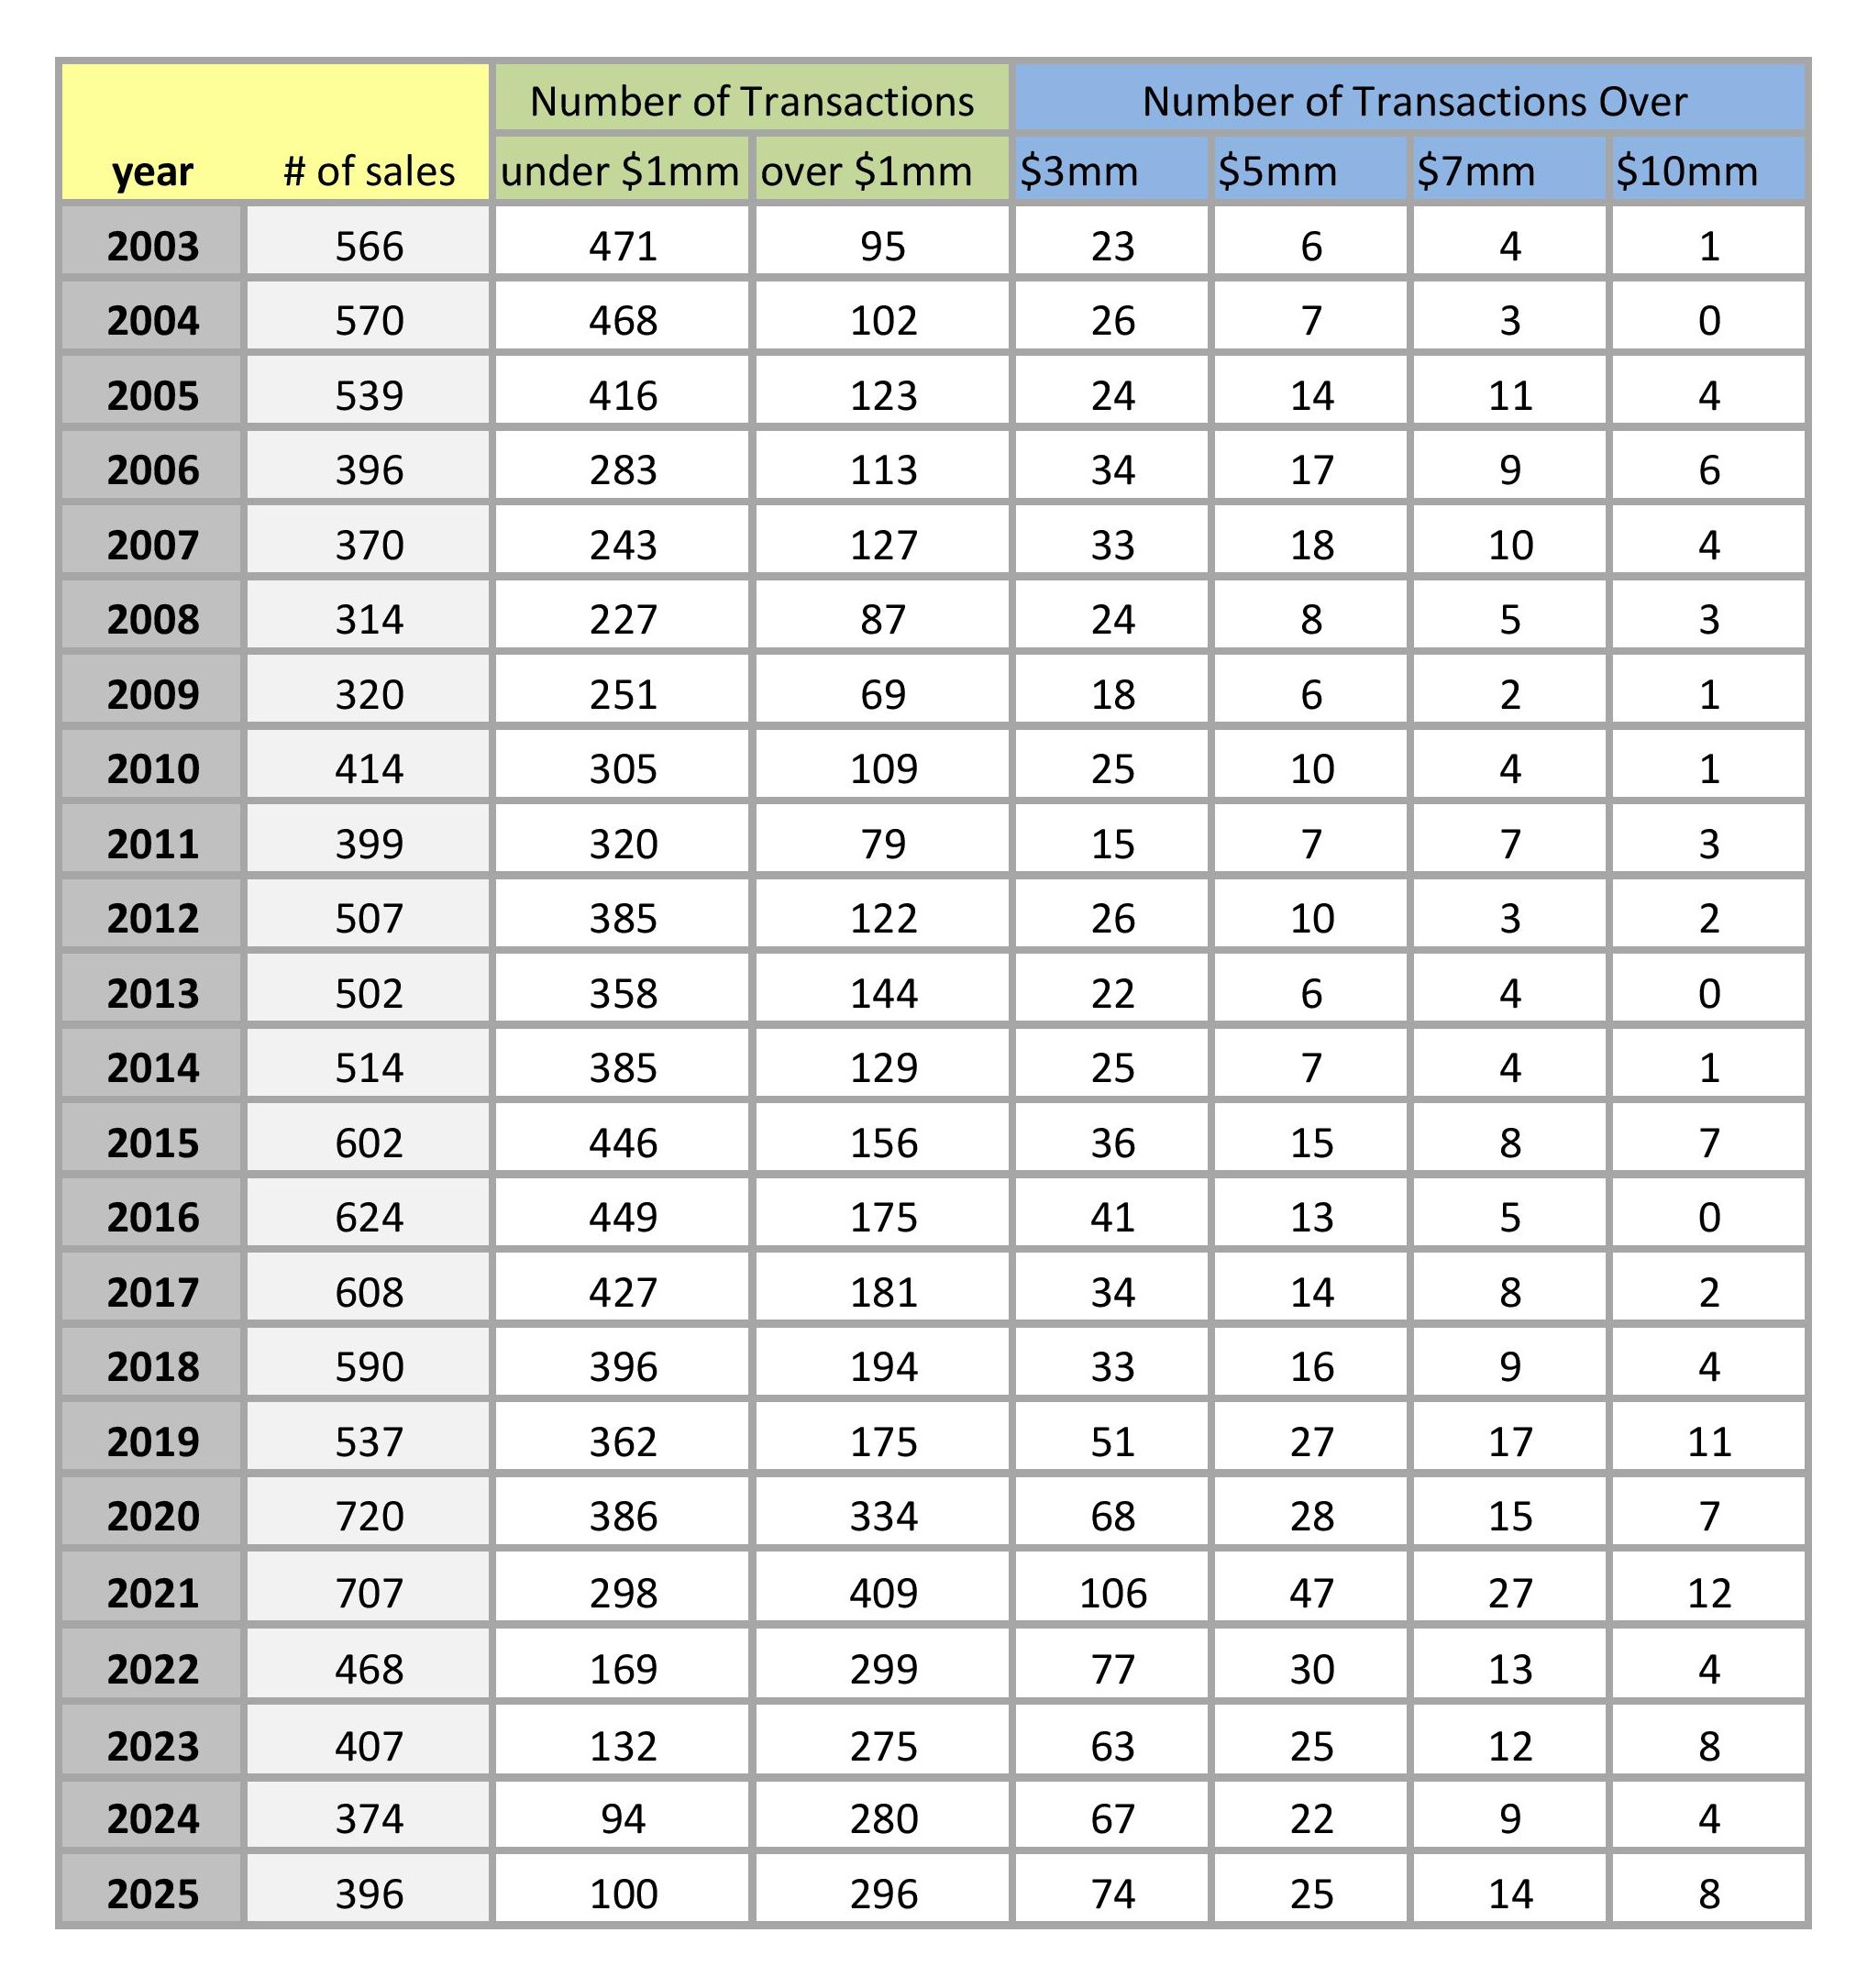
All segments of the high-end on Martha’s Vineyard increased in 2025. Sales of $3+mm grew from 67 sales in 2024 to 74 in 2025. The category of $5+mm increased from 22 sales in 2024 to 25 in 2025. $7+mm sales increased from 9 transactions in 2024 to 14 in 2025. And finally, the ultra high-end $10+mm segment doubled from 4 transactions in 2024 with the highest price of $14.63mm to 8 transactions in 2025 with two sales at $37mm and $37.5mm. Although 2024 was a soft year for the high-end segment of the market, 2025 performance outpaced the high-end in 2023 as well. Undoubtedly, 2025 was a strong year for the high-end market.
There were two record-breaking transactions at $37+mm in 2025, one in Edgartown and one in Chilmark. These are the highest sales the island has seen to date and two of only three residential sales ever over $30mm on Martha’s Vineyard. The Edgartown property sold for $37,500,000. It is a 3-acre harborfront estate with over 16,000 square feet of living space between a 7-bedroom main house and a carriage house with two separate one-bedroom apartments. Additionally, this property features water views, covered porches and decks, a deep water dock, swimming pool, and a 2000 square foot lower level entertaining space with bowling alley. The Chilmark property sold for $37,000,000. It is a 28.5-acre property on the Tisbury Great Pond. Known as Blue Heron Farm, it included two houses with 9 bedrooms total and spectacular grounds with gardens, lawn and wooded areas. There is a barn, riding ring and horse paddocks, tennis court, swimming pool and pool house, gym, boathouse, dock and private beach. It was once the summer vacation rental of President and Mrs. Obama and family.
In 2025, the overall high-end segment of the market, all properties $3+mm, represented 51% of total island-wide dollar volume (up from 46% in 2024, 2023 and 2022) and 18% of all transactions (flat from 2024).
Sales of vacant buildable parcels continued to slow in 2025. Despite increased inventory of vacant parcels in 2025, there were 43 vacant land sales in 2025 versus 54 in 2024, a 20% drop. Peak inventory for vacant parcels was 57 properties in 2025 versus 38 in 2024 and 40 and 2023. This segment has been on a downward trend since 2021. Vacant buildable parcels declined from 100 transactions in 2021 to 77 in 2022, then decreased to 54 in 2023 and then remained flat in 2024 with 54 transactions. With just 43 sales in 2025, this represents a 57% drop in the sales of vacant parcels over the past five years. Dollar volume of land sales dropped 33% from $68.5mm in 2024 to $46.0mm in 2025. These buildable land sales represented 11% of all transactions on the island in 2025 (down from 14% in 2024).
Looking at high-end land sales, there was just one sale over $3mm in 2025 (versus 4 transactions in category in 2024 and 6 in 2023). This was a $5mm sale of a 4.1-acre parcel located on Oyster Pond in Edgartown with a large outbuilding/barn and open meadow building site.
Average price of buildable parcels decreased from $1.27mm in 2024 to $1.07mm in 2025. Median price declined from $867,500 in 2024 to $700,500 in 2025.
Beach Lots represent a separate segment of land sales. These are unbuildable properties which convey ownership in private beaches on the island. This segment increased to 8 transactions in 2025, up from 3 in 2024. These 8 beach lot sales were all in Chilmark in 2025 and ranged from $105,000 to $650,000. It is impossible to hypothesize about this market segment because inventory drives it and the availability of these properties is erratic and unpredictable.
The sale of commercial properties increased from 15 commercial transactions 2024 to 18 transactions in 2025. Of the 18 commercial transactions in 2025, 8 were in Oak Bluffs, 5 were in Tisbury, 4 were in Edgartown, and 1 was in West Tisbury. The highest priced commercial transaction was the $4.95mm sale of a mixed used building in the center of Circuit Ave with an established restaurant space on ground level and three apartments above with a total of eight bedrooms.
Conclusion
After the explosive growth during the COVID pandemic and the uncertain shifting in the aftermath of that era, the Martha’s Vineyard real estate market strengthened and steadied itself in 2025. The 2025 results have landed this market on solid ground with a slower pace and consistent, high demand supporting bullish prices.
Last year we discussed slower activity, prices flattening, inventory starting to grow and a swing away from the Seller’s Market dynamics of COVID. The obvious correction this year, resulting from the 2025 numbers, is the increase in prices across the board from average prices to median and overall dollar volume. The one exception to increased pricing is the category of vacant buildable land. The softening here may be caused by building costs which skyrocketed during COVID and have remained high. Otherwise, the demand for Vineyard properties continues to support and drive up the current pricing levels.
As we mentioned in years past, housing is more than just an economic asset. Whether you are considering a seasonal vacation home or a year-round property, you are likely thinking about family and friends, what the Vineyard offers, where you are in your own life cycle, what you are looking forward to and what you would like to change. There are many reasons people choose to buy or sell at any moment in time. For those who can afford it and have waited on the sidelines for the market to improve, the 2025 results may help you make a decision to move forward in 2026. For Sellers, as always, pricing appropriately will drive more buyers to your property and lead to a successful outcome.
If you are thinking of selling or buying real estate on the island, it is important to consult with your agent to better understand the market specific to your needs, and strategize so that you can move adeptly as the opportunity arises.
National and global events will continue to affect our local economy, for good or bad. What we have learned from the past several years is to expect the unexpected, from the pandemic to politics to wars to interest rates. But the straightforward results of the 2025 market help make decisions about property on the island a little clearer. We remain optimistic about the year ahead for buyers and sellers alike.
TEA LANE ASSOCIATES' 2025 HIGHLIGHTS
Tea Lane Associates sold property in all six towns in 2025 and represented the buyer and/or seller in four of the six sales in Aquinnah. Tea Lane sold the second highest priced property in Tisbury and represented the buyer in the third highest priced property in West Tisbury.
Tea Lane Associates worked with Buyers and Sellers of property on the Edgartown Great Pond, waterfront on the North Shore in West Tisbury and Aquinnah, a renovated historic home in Vineyard Haven, homes with substantial acreage in Chilmark, vacant parcels in Chilmark, West Tisbury and Vineyard Haven, beach lots, seasonal houses, new builds and renovation projects, commercial property as well as year-round homes all around the island.
Tea Lane Associates’ sales represented 60% of Aquinnah dollar volume, 16% of West Tisbury dollar volume, 12% of Chilmark dollar volume, 17% of all up-island dollar volume, and 8% of dollar volume island-wide.
Tea Lane Associates represented buyers and sellers at all price points. We worked with buyers who have been coming to the Vineyard for their lifetime and buyers who discovered the island more recently, with buyers who were upgrading on the island, buyers who were downsizing and with buyers who were expanding their holdings on the island. We helped families purchase their year-round homes, and buyers who were setting up for retirement. We worked with sellers (individuals, groups of family members, trustees, business partners) to list and sell a wide range of properties from vacant land, to new construction, to beloved generational family homes. All are an important part of what we do and we were honored to be part of a new chapter in our clients’ lives.
In 2025, as the Martha’s Vineyard affiliate of Forbes Global Properties, Tea Lane Associates tapped into our global marketing network to create high quality and broad reach exposure for our Seller clients including:
1 listing featured as an article in the Wall Street Journal
1 listing covered by the Robb Report
2 listings that were written up in Cottages and Gardens, and Boston Magazine
2 sales featured as notable in Forbes
5 listings that were covered as features in Forbes, 2 that were front page in the Forbes Lifestyle section
Forbes Global Properties connects buyers and sellers of luxury properties worldwide and is the exclusive real estate partner of Forbes, one of the world’s most trusted media brands.