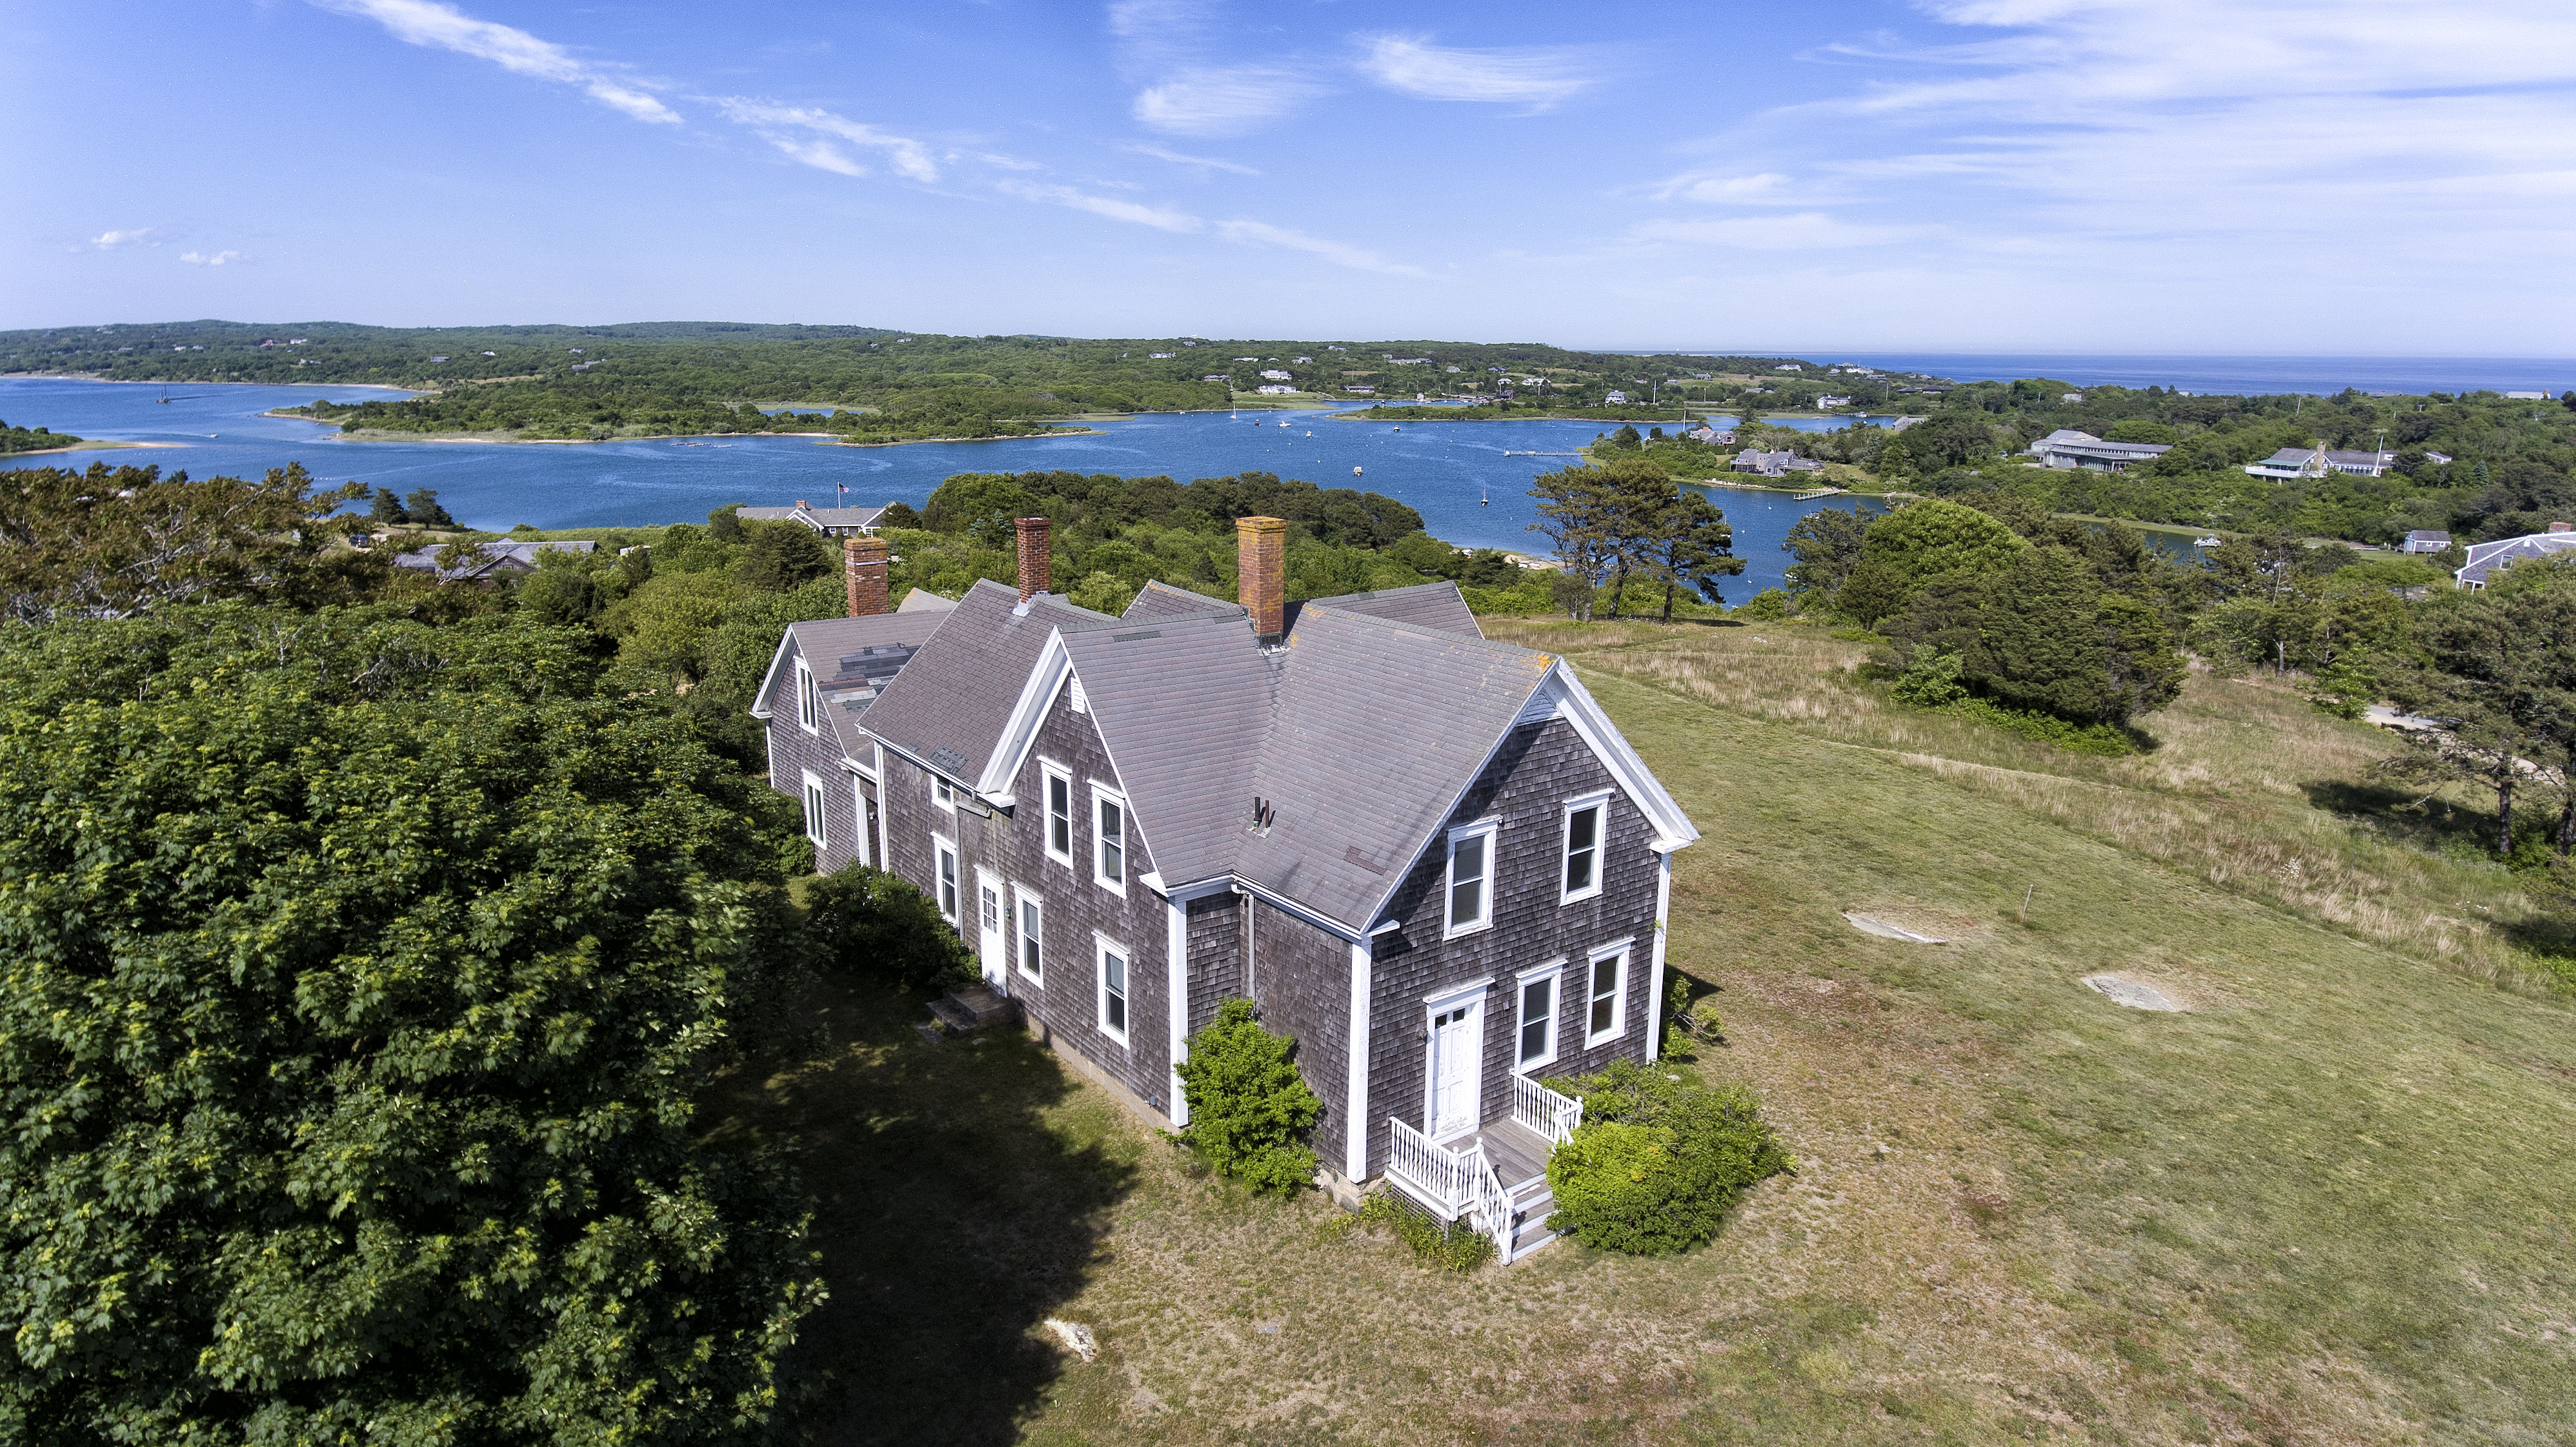
Feb 2019 - Martha's Vineyard 2018 Real Estate Market Review
Image

Martha's Vineyard 2018 Real Estate Market Review
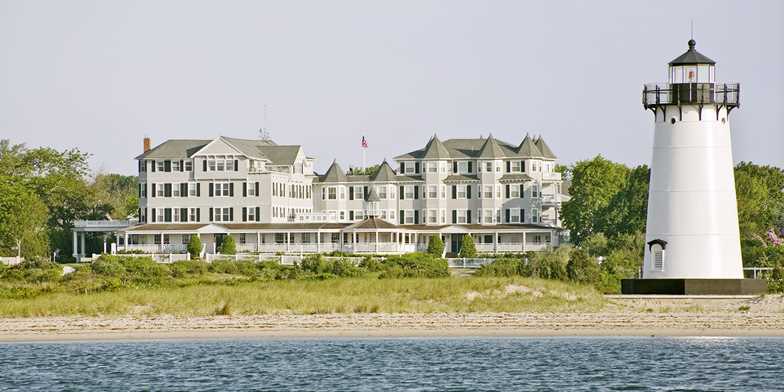
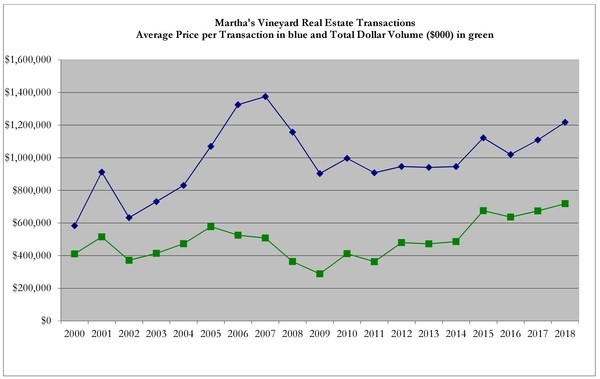
The island real estate market posted another solid year in 2018. Although the number of transactions slipped slightly in 2018, a 3% decrease to 590 sales, total dollar volume rose 6.6% in 2018 to $718mm, and average sales price rose 10% to $1.218mm. 2018 continued the trend of consistent growth and activity since 2015 when the market surged, proving it had recovered from the “great recession”. 2018 is the fourth consecutive year of expanding dollar volume and the first time the market has broken through the $700mm mark in total dollar volume. One transaction which pushed the market over this threshold was the sale of the Harbor View Hotel in Edgartown for $30mm. But even without this sale, the total dollar volume grew 2% and average price increased 5.4% in 2018. Overall 2018 was a very healthy year for the Martha’s Vineyard Real Estate market.
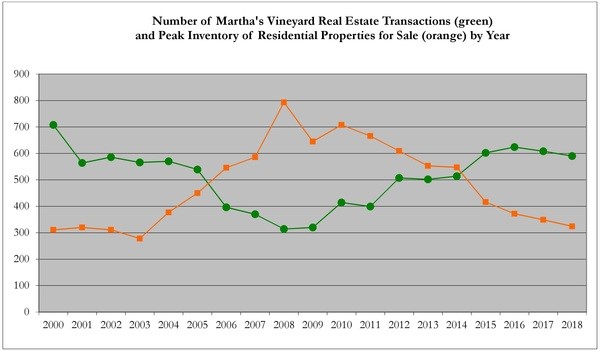
While some real estate markets across the country show signs of a slowdown, the Vineyard does not yet seem affected. For many segments of the market, 2018 had the dynamics of a Seller’s market. However, it is worth noting that 2018 is the second year in a row with declining number of sales. Though modest, -2.6% in 2017 and -3% in 2018, this decline may be caused by a lack of residential property inventory which fell to its lowest level since 2005, or it may be indicating a shift in the market. Whatever the case, this trend of fewer sales may keep some pressure on rising prices. Although average price in 2018 rose 10% ($1.218mm), it has not reached the level of average price during the last peak of the market in 2006 and 2007 ($1.325mm and $1.375mm respectively).
While the above statistics include all transactions and represent island-wide performance, individual towns and market segments reveal different dynamics in 2018. Martha’s Vineyard is an island with six towns, each with its own character and specific market conditions. Within each town there are different niches as well…waterfront, water view, high-end, mid-range, entry level and commercial properties. Generalizing trends or making broad statements is challenging because each market segment can be, on its own, very small. However, it is worth diving in to the different towns and niches to understand their role in the overall market performance.
Up-Island
Chilmark
Chilmark experienced a slow 2018 where the total number of transactions dropped 23% from 56 in 2017 to 43 in 2018 and total dollar volume fell 28% from $99mm in 2017 to $71mm in 2018. Therefore average price declined as well, a loss of 6% from $1.763mm in 2017 to $1.658mm in 2018. Note that these numbers include unbuildable beach lot sales of which there were 9 in Chilmark in 2018 versus only 5 in 2017 which contributes to the decrease in average price. Considering Chilmark’s numbers excluding beach lot sales in 2017 and 2018, average price of all other transactions actually rose 5.4% from $1.91mm in ’17 to $2.013mm in ’18.
Looking more closely at specific segments of the Chilmark market, the $1-3mm range held steady from ’17 to ’18 with 27 sales in 2017 and 28 in 2018. It is the high end over $5mm that has experienced the most significant slowdown over the past couple of years, causing the overall drop in dollar volume. In 2018, there were only 5 sales over $3mm in Chilmark, down from 6 in 2017 and 14 in 2016. Looking further into how these sales were distributed we see that in 2018 there were only 2 sales over $4 mm in Chilmark, down from 5 sales in 2017 and 12 sales in 2016.
Chilmark represented 7% of total transactions on the island and 10% of total dollar volume on the island in 2018. It is a small market of high-end properties where a few sales can make an impact. In 2018, one of the four sales on the island over $10mm was located on the south shore of Chilmark: a 7000 square foot house and guesthouse built in 2006 on 9.5 acres with sweeping water views, pool and private association beach sold for $15mm.

West Tisbury posted mixed results in 2018. While the total number of transactions fell 10% to 60 (from 67 in ’17), total dollar volume held steady at $68mm during both 2017 and 2018. Average price increased 10% to $1.14mm in 2018 (from $1.04mm in ’17). There were 12 fewer sales under $1mm in 2018 in West Tisbury compared to 2017, but the dollar volume held because of a significant uptick in sales in the $1-2mm, from 11 in 2017 to 18 in 2018.
In 2018, West Tisbury represented 10% of total transactions on the island and 10% of dollar volume island-wide.
Activity slowed in Aquinnah in 2018. This smallest market on the island represented 2% of total island-wide transactions and dollar volume. In 2018, the total number of transactions fell by 5 sales (from 17 in ’17 to 12 in ’18) which translates to a 29% decrease. Total dollar volume declined 21% (from $19mm in ’17 to $15mm in ’18) but average sales price followed the island-wide trend and rose 12.5% (from $1.11mm in ’17 to $1.25mm in ’18).
Down Island
Edgartown is the largest market on the island with the most expansive price range, and it grew to represent half of the total dollar volume of sales on the island in 2018. The total number of transactions in Edgartown grew a modest 4% from 197 in 2017 to 205 in 2018 but total dollar volume, after increasing 27% in 2017, managed to increase again by 26% from $282mm in 2017 to $356mm in 2018. Average price grew 21% from $1.43mm in 2017 to $1.736 in 2018. This was a strong year for the Edgartown market.
Edgartown’s mid-range sales grew significantly in 2018 with 63 sales in the $1-3mm range versus 54 sales in this range in 2017. Also the high end over $5mm experienced significant growth from 7 sales over $5mm in 2017 to 12 over $5mm in 2018, with three sales over $10mm in 2018 (versus 2 sales over $10mm in 2017). One of the three transactions over $10mm in Edgartown in 2018 was the sale of the Harbor View Hotel for $30mm. This was the highest transaction on the island in 2018. But even without the Harbor View sale, Edgartown surged with a 15% jump in dollar volume and 11% increase in average price.
In 2018, Edgartown’s activity represented 35% of total number of transactions on the island and 50% of total dollar volume island-wide.

Oak Bluffs performed well in 2018 with the number of transactions gaining 12% from 140 in 2017 to 157 in 2018 and total dollar volume increasing 17% from $96mm in 2017 to $112mm in 2018. Average price increased 4% from $687k in 2017 to $714mm in 2018. Both the high and low end market segments picked up sales in 2018 – with 13 more sales under $1mm in 2018 (118 sales under $1mm in ’17 and 132 sales in this segment in 2018) and 3 more sales over $2mm in 2018 (3 sales over $2mm in ‘17 versus 6 in ‘18).
Oak Bluffs represented 27% of total transactions on the island in 2018 and 16% of total dollar volume island-wide.
Tisbury (Vineyard Haven) posted weak results in 2018. Total number of transactions fell 14% (from 131 in ’17 to 113 in ’18) and total dollar volume fell 12% (from $108.5mm in ’17 to $95.7mm in ‘18). Average priced managed to grow slightly, up 2% from $828k in ’17 to $847k in ‘18.
Tisbury’s mid-range market was strong in 2018 with 9 sales between $2mm and $3mm (versus 3 sales in this price range in 2017). The growth of this segment offset the decline of sales over $5mm of which there were 2 in 2017 and none in 2018.
Tisbury activity in 2018 represented 19% of total transactions on the island and 13% of total dollar volume island-wide.
Entry Level Sales
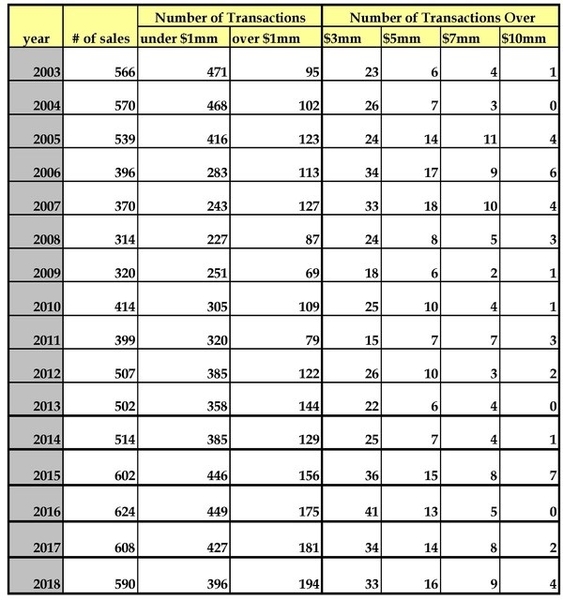
The rising prices of the past few years hits entry level buyers hard. In 2017 the number of sales under $1mm dropped to 427 sales (versus 449 in ’16) and that trend continued in 2018 with only 396 sales under $1mm. For the second year in a row, it became harder to enter the Vineyard market.
This segment of the market under $1mm had been growing consistently over the last decade with increased transactions each year (except 2013) making it easier to enter the market year after year. Over the past 10 years the number of transactions under $1mm grew from 227 in 2008 to the peak of 449 in 2016. This dynamic shifted in 2017 and continued it’s downward slide in 2018.
High End Sales
Sales over $1mm climbed again in 2018 to 194 (from 181 in ‘17). The $1-2mm range remained stable with a slight increase of 3 sales from 112 in ’17 to 115 in ’18. The strongest segment was the $2mm-4mm range with a 39% increase in activity (from 44 transactions in ’17 to 61 in ’18). There was also growth in the $5mm+ range with 29 transactions in 2018 versus 24 in '17, an increase of 21%.
As we noted last year, the high end market is strong, but the highest end niches have not reached the level of the real estate market peak of 2005-2007. Looking at the three-year period of 2016-2018, there were only 6 sales over $10mm (a decline from 14 sales between 2005-2007), 22 sales over $7 million (a decline from 30 sales between 2005-2007) and 43 sales over $5mm (a decline from 49 sales between 2005-2007). This is in contrast to 108 sales over $3mm between 2015-2017 (an increase from 91 sales between 2005-2007) and 550 sales over $1mm (an increase from 363 sales between 2005-2007).
Land Sales
Vacant land sales represented 9% of total sales on the island in 2018 at $67mm. This was an 11% increase in dollar volume for land sales compared to 2017 ($61mm) but an 8% drop in the number of transactions from 99 in 2017 to 91 in 2018. These numbers include the sale of unbuildable beach lots. There were 5 beach lots sold in 2017 (4 in Chilmark, 1 in Aquinnah) and 11 beach lots sold in 2018 (9 in Chilmark, 1 in Aquinnah and 1 in West Tisbury). Looking at buildable parcels, sales slowed from 93 in 2017 to 80 in 2018, while the average price rose 26% in 2018 from $636k in 2017 to $800k in 2018.
There were 4 buildable land sales over $2mm in 2018 (down from 6 sales over $2mm in 2017.) Of these 2018 land sales, the highest was $10.8mm for a 4.4-acre waterfront parcel in Edgartown on the harbor with a deep water dock. The next highest land sale was $5.41mm for an 18.5-acre pond front parcel in West Tisbury with easy access to private association beach on the South Shore and 141 acres of common land. The other two vacant parcel sales over $2mm were a 22-acre parcel in West Tisbury for $3mm and a 3.1-acre parcel on Menemsha Pond in Chilmark for $2.55mm.
Commercial Sales
The sale of commercial properties jumped to 24 transactions in 2018 (up from 13 in 2017). These sales were weighted to Tisbury with 11 sales, followed by 8 in Edgartown, 4 in Oak Bluffs and 1 in West Tisbury. There were three commercial transactions over $5mm in 2018, all of which were lodging/hotel properties. As mentioned previously the Harbor View Hotel in Edgartown sold for $30mm. Additionally in Edgartown, the Clarion Inn property sold for $8mm and in West Tisbury, the Lambert’s Cove Inn sold for $5.5mm.
Conclusion
Although 2018 was a solid year for the island’s overall real estate market, the total dollar volume and number of transactions in 4 of the 6 towns declined or remained flat from 2017 to 2018. Two towns carried the torch for growth in 2018: Edgartown and Oak Bluffs. However, due to the dynamics of a seller’s market among many segments, average prices rose in all towns on the island. The inconsistent distribution of sales across the island may have been caused by lack of inventory in certain towns and certain segments of the market. Inventory levels for residential property fell for the eighth consecutive year to the lowest level since 2005. This dynamic keeps prices climbing but there are still good deals to be had for buyers who know the market and understand the elements of value in their desired category. Additionally, rising interest rates, changes in the mortgage deduction, uncertainty about the stock market, and concerns about the overall direction of the country certainly weigh heavy on Buyers and cannot be ignored by Sellers. These factors may prove to balance out some of the negotiating power between Buyers and Sellers in the year to come.
Market Trend Graphs

2018 Tea Lane Associates' Year-End Highlights
- Tea Lane Associates sold property in all six towns including:
- the highest priced, non-commercial property in West Tisbury which was also the second highest price, non-commercial, brokered sale up-island in 2018.
- the second highest priced, brokered property in Aquinnah.
- the third highest priced brokered property in Chilmark
- Tea Lane Associates’ sales represented 26% of all up-island sales dollar volume, and 7% of dollar volume island-wide.
- Tea Lane Associates’ sales represented 27% of dollar volume in Aquinnah, 23% of dollar volume in Chilmark and 29% of dollar volume in West Tisbury.
Tea Lane Associates represented buyers and sellers at all price points. We worked with buyers purchasing their year-round family home, with buyers purchasing their retirement home and with buyers purchasing their perfect vacation retreat. We worked with sellers to list and sell a wide range of properties.
All are an important part of what we do and we were honored to be part of a new chapter in our clients’ lives.